UPS 2013 Annual Report Download - page 114
Download and view the complete annual report
Please find page 114 of the 2013 UPS annual report below. You can navigate through the pages in the report by either clicking on the pages listed below, or by using the keyword search tool below to find specific information within the annual report.-
 1
1 -
2
-
3
-
4
-
5
-
6
-
7
-
8
-
9
-
10
-
11
-
12
-
13
-
14
-
15
-
16
-
17
-
18
-
19
-
20
-
21
-
22
-
23
-
24
-
25
-
26
-
27
-
28
-
29
-
30
-
31
-
32
-
33
-
34
-
35
-
36
-
37
-
38
-
39
-
40
-
41
-
42
-
43
-
44
-
45
-
46
-
47
-
48
-
49
-
50
-
51
-
52
-
53
-
54
-
55
-
56
-
57
-
58
-
59
-
60
-
61
-
62
-
63
-
64
-
65
-
66
-
67
-
68
-
69
-
70
-
71
-
72
-
73
-
74
-
75
-
76
-
77
-
78
-
79
-
80
-
81
-
82
-
83
-
84
-
85
-
86
-
87
-
88
-
89
-
90
-
91
-
92
-
93
-
94
-
95
-
96
-
97
-
98
-
99
-
100
-
101
-
102
-
103
-
 104
104 -
 105
105 -
 106
106 -
 107
107 -
 108
108 -
 109
109 -
 110
110 -
 111
111 -
 112
112 -
 113
113 -
 114
114 -
 115
115 -
 116
116 -
 117
117 -
 118
118 -
 119
119 -
 120
120 -
 121
121 -
 122
122 -
 123
123 -
 124
124 -
125
-
126
-
127
-
128
-
129
-
130
-
131
-
132
-
133
-
134
-
135
-
136
 |
 |

UNITED PARCEL SERVICE, INC. AND SUBSIDIARIES
NOTES TO CONSOLIDATED FINANCIAL STATEMENTS
102
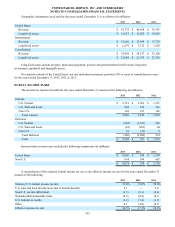
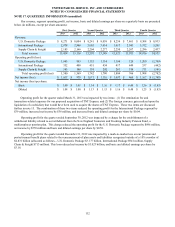
Geographic information as of, and for the years ended, December 31 is as follows (in millions):
2013 2012 2011
United States:
Revenue $ 41,772 $ 40,428 $ 39,347
Long-lived assets $ 15,651 $ 16,262 $ 16,085
International:
Revenue $ 13,666 $ 13,699 $ 13,758
Long-lived assets $ 6,297 $ 5,312 $ 5,220
Consolidated:
Revenue $ 55,438 $ 54,127 $ 53,105
Long-lived assets $ 21,948 $ 21,574 $ 21,305
Long-lived assets include property, plant and equipment, pension and postretirement benefit assets, long-term
investments, goodwill, and intangible assets.
No countries outside of the United States, nor any individual customers, provided 10% or more of consolidated revenue
for the years ended December 31, 2013, 2012 or 2011.
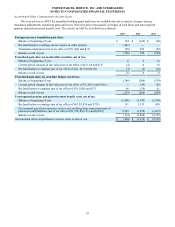
NOTE 12. INCOME TAXES
The income tax expense (benefit) for the years ended December 31 consists of the following (in millions):
2013 2012 2011
Current:
U.S. Federal $ 2,181 $ 1,901 $ 1,371
U.S. State and Local 205 182 121
Non-U.S. 162 167 166
Total Current 2,548 2,250 1,658
Deferred:
U.S. Federal (242)(1,871) 262
U.S. State and Local (22)(201) 44
Non-U.S. 18 (11) 8
Total Deferred (246)(2,083) 314
Total $ 2,302 $ 167 $ 1,972
Income before income taxes includes the following components (in millions):
2013 2012 2011
United States $ 6,040 $ 384 $ 5,309
Non-U.S. 634 590 467
$ 6,674 $ 974 $ 5,776
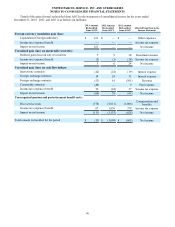
A reconciliation of the statutory federal income tax rate to the effective income tax rate for the years ended December 31
consists of the following:
2013 2012 2011
Statutory U.S. federal income tax rate 35.0% 35.0% 35.0%
U.S. state and local income taxes (net of federal benefit) 2.1 — 2.0
Non-U.S. tax rate differential (1.3)(6.1)(0.4)
Nondeductible/nontaxable items (0.2)(0.4)(0.1)
U.S. federal tax credits (1.2)(7.4)(1.7)
Other 0.1 (4.0)(0.7)
Effective income tax rate 34.5% 17.1% 34.1%