UPS 2013 Annual Report Download - page 51
Download and view the complete annual report
Please find page 51 of the 2013 UPS annual report below. You can navigate through the pages in the report by either clicking on the pages listed below, or by using the keyword search tool below to find specific information within the annual report.-
 1
1 -
2
-
3
-
4
-
5
-
6
-
7
-
8
-
9
-
10
-
11
-
12
-
13
-
14
-
15
-
16
-
17
-
18
-
19
-
20
-
21
-
22
-
23
-
24
-
25
-
26
-
27
-
28
-
29
-
30
-
31
-
32
-
33
-
34
-
35
-
36
-
37
-
38
-
39
-
40
-
 41
41 -
 42
42 -
 43
43 -
 44
44 -
 45
45 -
 46
46 -
 47
47 -
 48
48 -
 49
49 -
 50
50 -
 51
51 -
 52
52 -
 53
53 -
 54
54 -
 55
55 -
 56
56 -
 57
57 -
 58
58 -
 59
59 -
 60
60 -
 61
61 -
62
-
63
-
64
-
65
-
66
-
67
-
68
-
69
-
70
-
71
-
72
-
73
-
74
-
75
-
76
-
77
-
78
-
79
-
80
-
81
-
82
-
83
-
84
-
85
-
86
-
87
-
88
-
89
-
90
-
91
-
92
-
93
-
94
-
95
-
96
-
97
-
98
-
99
-
100
-
101
-
102
-
103
-
104
-
105
-
106
-
107
-
108
-
109
-
110
-
111
-
112
-
113
-
114
-
115
-
116
-
117
-
118
-
119
-
120
-
121
-
122
-
123
-
124
-
125
-
126
-
127
-
128
-
129
-
130
-
131
-
132
-
133
-
134
-
135
-
136
 |
 |
UNITED PARCEL SERVICE, INC. AND SUBSIDIARIES
MANAGEMENT'S DISCUSSION AND ANALYSIS OF FINANCIAL CONDITION AND
RESULTS OF OPERATIONS
39
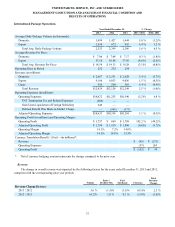
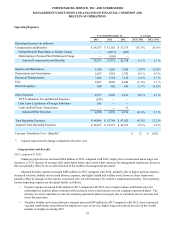
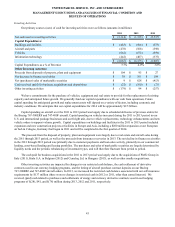
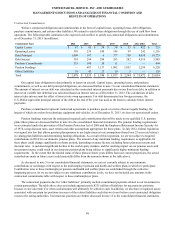
Operating Expenses
Year Ended December 31, % Change
2013 2012 2011 2013 / 2012 2012 / 2011
Operating Expenses (in millions):
Compensation and Benefits $ 28,557 $ 33,102 $ 27,575 (13.7)% 20.0 %
Defined Benefit Plans Mark-to-Market Charge —(4,831)(827)
Multiemployer Pension Plan Withdrawal Charge —(896) —
Adjusted Compensation and Benefits 28,557 27,375 26,748 4.3 % 2.3 %
Repairs and Maintenance 1,240 1,228 1,286 1.0 % (4.5)%
Depreciation and Amortization 1,867 1,858 1,782 0.5 % 4.3 %
Purchased Transportation 7,486 7,354 7,232 1.8 % 1.7 %
Fuel 4,027 4,090 4,046 (1.5)% 1.1 %
Other Occupancy 950 902 943 5.3 % (4.3)%
Other Expenses 4,277 4,250 4,161 0.6 % 2.1 %
TNT Termination Fee and Related Expenses (284) — —
Gain Upon Liquidation of Foreign Subsidiary 245 — —
Gains on Real Estate Transactions — — 33
Adjusted Other Expenses 4,238 4,250 4,194 (0.3)% 1.3 %
Total Operating Expenses $ 48,404 $ 52,784 $ 47,025 (8.3)% 12.2 %
Adjusted Total Operating Expenses $ 48,365 $ 47,057 $ 46,231 2.8 % 1.8 %
Currency Translation Cost / (Benefit)* $ 12 $ (362)
* Amount represents the change compared to the prior year.
Compensation and Benefits
2013 compared to 2012
Employee payroll costs increased $684 million in 2013 compared with 2012, largely due to contractual union wage rate
increases, a 3.1% increase in average daily union labor hours, and a merit salary increase for management employees; however,
this was partially offset by an overall reduction in the number of management personnel.
Adjusted benefits expense increased $498 million in 2013 compared with 2012, primarily due to higher pension expense,
increased vacation, holiday and excused absence expense, and higher health and welfare costs; however, these items were
partially offset by changes in the expense associated with our self-insurance for worker’s compensation claims. These primary
factors impacting expense are discussed further as follows:
• Pension expense increased $300 million in 2013 compared with 2012, due to higher union contribution rates for
multiemployer pension plans combined with increased service and interest costs for company-sponsored plans. The
increase in service and interest costs for company-sponsored plans was largely due to continued service accruals and
lower discount rates.
• Vacation, holiday and excused absence expense increased $89 million in 2013 compared with 2012, due to increased
vacation entitlements earned based on employees' years of service, higher wage rates and an increase in the overall
number of employees during 2013.