UPS 2013 Annual Report Download - page 42
Download and view the complete annual report
Please find page 42 of the 2013 UPS annual report below. You can navigate through the pages in the report by either clicking on the pages listed below, or by using the keyword search tool below to find specific information within the annual report.-
 1
1 -
2
-
3
-
4
-
5
-
6
-
7
-
8
-
9
-
10
-
11
-
12
-
13
-
14
-
15
-
16
-
17
-
18
-
19
-
20
-
21
-
22
-
23
-
24
-
25
-
26
-
27
-
28
-
29
-
30
-
31
-
 32
32 -
 33
33 -
 34
34 -
 35
35 -
 36
36 -
 37
37 -
 38
38 -
 39
39 -
 40
40 -
 41
41 -
 42
42 -
 43
43 -
 44
44 -
 45
45 -
 46
46 -
 47
47 -
 48
48 -
 49
49 -
 50
50 -
 51
51 -
 52
52 -
53
-
54
-
55
-
56
-
57
-
58
-
59
-
60
-
61
-
62
-
63
-
64
-
65
-
66
-
67
-
68
-
69
-
70
-
71
-
72
-
73
-
74
-
75
-
76
-
77
-
78
-
79
-
80
-
81
-
82
-
83
-
84
-
85
-
86
-
87
-
88
-
89
-
90
-
91
-
92
-
93
-
94
-
95
-
96
-
97
-
98
-
99
-
100
-
101
-
102
-
103
-
104
-
105
-
106
-
107
-
108
-
109
-
110
-
111
-
112
-
113
-
114
-
115
-
116
-
117
-
118
-
119
-
120
-
121
-
122
-
123
-
124
-
125
-
126
-
127
-
128
-
129
-
130
-
131
-
132
-
133
-
134
-
135
-
136
 |
 |

UNITED PARCEL SERVICE, INC. AND SUBSIDIARIES
MANAGEMENT'S DISCUSSION AND ANALYSIS OF FINANCIAL CONDITION AND
RESULTS OF OPERATIONS
30
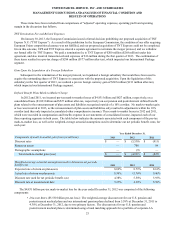
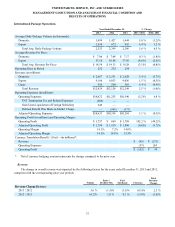
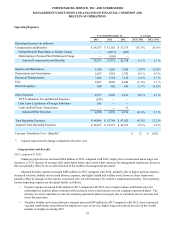
Fuel Surcharges
UPS applies a fuel surcharge on our domestic air and ground services. The air fuel surcharge is based on the U.S.
Department of Energy’s (“DOE”) Gulf Coast spot price for a gallon of kerosene-type jet fuel, while the ground fuel surcharge is
based on the DOE’s On-Highway Diesel Fuel Price. Based on published rates, the average fuel surcharge rates for domestic air
and ground products were as follows:
Year Ended December 31, % Point Change
2013 2012 2011 2013 / 2012 2012 / 2011
Next Day Air / Deferred 10.7% 13.0% 13.3% (2.3)% (0.3)%
Ground 7.2% 8.0% 8.0% (0.8)% — %
In connection with our base rate increases on December 31, 2012 and January 2, 2012, we modified the fuel surcharge on
air and ground services by reducing the index used to determine the fuel surcharge by 2% and 1%, respectively, each year. The
2013 decreases in the air and ground fuel surcharge rates were due to the decline in jet and diesel fuel prices, combined with the
reductions in the index on both the air and ground surcharges. These factors resulted in a $178 million decline in fuel surcharge
revenue in 2013. In 2012, the reductions to the index offset the increase in jet and diesel fuel prices, resulting in a small
decrease in the average air fuel surcharge rate and no change in the average ground surcharge rate. Fuel surcharge revenue
increased $54 million in 2012, primarily due to volume growth.
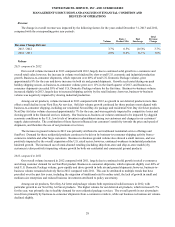
Operating Expenses
2013 compared to 2012
Adjusted operating expenses for the segment increased $1.147 billion in 2013 compared with 2012. This increase was
primarily due to pick-up and delivery costs, which grew $772 million, as well as the cost of operating our domestic integrated
air and ground network, which increased $290 million for the year. The growth in pick-up and delivery and network costs was
largely due to increased volume and higher employee compensation costs, which were impacted by a union contractual wage
increase (package driver wage rates rose 2.2%), an increase in average daily driver hours (up 2.2%) and an increase in
employee pension and healthcare costs. Partially offsetting these cost increases was a reduction in worker's compensation
expense, due to actuarial adjustments that were largely attributable to operational safety and claims management initiatives.
Cost increases have been mitigated as we adjust our air and ground networks to better match higher volume levels and
utilize technology to increase package sorting and delivery efficiency. Improved pick-up and delivery densities, particularly for
our residential products, have also contained increases in cost. These network efficiency improvements allowed us to process
increased volume (up 3.7%) at a faster rate than the increase in average daily union labor hours (up 3.1%), aircraft block hours
(down 0.6%) and miles driven (up 1.8%) in 2013 compared with 2012. As a result, the total adjusted cost per piece increased
only 0.4% in 2013.
Several factors caused our fourth quarter operating expenses to significantly increase (adjusted operating expenses
increased $553 million, or 7.3%, in the fourth quarter of 2013 compared with the same period of 2012). Higher-than-planned
volume growth, combined with adverse weather conditions and the relatively compressed holiday shipping season in 2013
(there were six fewer days between the Thanksgiving and Christmas holidays in 2013 relative to 2012), resulted in a significant
increase in labor hours and the greater use of contract carriers to help meet our service commitments. Additionally, the much
later-than-anticipated seasonal increase in volume during the fourth quarter strained our transportation network, resulting in
lower productivity (total union labor hours increased 6.2%, while volume increased 5.6% in the fourth quarter).
2012 compared to 2011
Overall adjusted operating expenses for the segment increased $865 million in 2012 compared with 2011. This increase
was primarily due to pick-up and delivery costs, which grew $682 million, as well as the cost of operating our domestic
integrated air and ground network, which increased $238 million for the year. The growth in pick-up and delivery and network
costs was largely due to increased volume and higher employee compensation costs, which were impacted by a union
contractual wage increase (package driver wage rates rose 2.0%), an increase in driver hours (up 1.1%) and increased employee
health care costs. These increases were partially offset by reductions in indirect operating costs of $79 million in 2012, largely
due to a decrease in the expense for management incentive awards.