UPS 2013 Annual Report Download - page 47
Download and view the complete annual report
Please find page 47 of the 2013 UPS annual report below. You can navigate through the pages in the report by either clicking on the pages listed below, or by using the keyword search tool below to find specific information within the annual report.-
 1
1 -
2
-
3
-
4
-
5
-
6
-
7
-
8
-
9
-
10
-
11
-
12
-
13
-
14
-
15
-
16
-
17
-
18
-
19
-
20
-
21
-
22
-
23
-
24
-
25
-
26
-
27
-
28
-
29
-
30
-
31
-
32
-
33
-
34
-
35
-
36
-
 37
37 -
 38
38 -
 39
39 -
 40
40 -
 41
41 -
 42
42 -
 43
43 -
 44
44 -
 45
45 -
 46
46 -
 47
47 -
 48
48 -
 49
49 -
 50
50 -
 51
51 -
 52
52 -
 53
53 -
 54
54 -
 55
55 -
 56
56 -
 57
57 -
58
-
59
-
60
-
61
-
62
-
63
-
64
-
65
-
66
-
67
-
68
-
69
-
70
-
71
-
72
-
73
-
74
-
75
-
76
-
77
-
78
-
79
-
80
-
81
-
82
-
83
-
84
-
85
-
86
-
87
-
88
-
89
-
90
-
91
-
92
-
93
-
94
-
95
-
96
-
97
-
98
-
99
-
100
-
101
-
102
-
103
-
104
-
105
-
106
-
107
-
108
-
109
-
110
-
111
-
112
-
113
-
114
-
115
-
116
-
117
-
118
-
119
-
120
-
121
-
122
-
123
-
124
-
125
-
126
-
127
-
128
-
129
-
130
-
131
-
132
-
133
-
134
-
135
-
136
 |
 |
UNITED PARCEL SERVICE, INC. AND SUBSIDIARIES
MANAGEMENT'S DISCUSSION AND ANALYSIS OF FINANCIAL CONDITION AND
RESULTS OF OPERATIONS
35
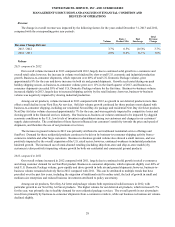
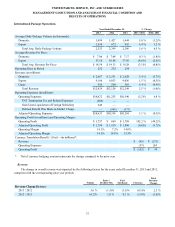
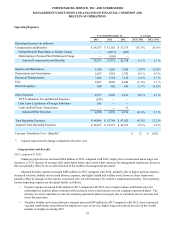
Partially offsetting these cost reductions was an increase in indirect operating costs, which increased $143 million in 2012
compared with 2011. This increase was impacted by our investment in enhanced security screening for our international
locations and expenses associated with business acquisition activities, including our proposed acquisition of TNT Express N.V.
(see note 15 to the consolidated financial statements) as well as the February 2012 acquisition of Kiala S.A.
Excluding the impact of currency exchange rate changes, the total cost per piece for the segment increased 2.3% in 2012
compared with 2011.
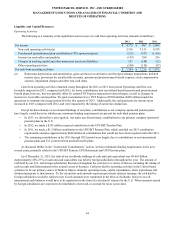
Operating Profit and Margin
2013 compared to 2012
Adjusted operating profit contracted by 0.8% in 2013 compared with 2012, while the adjusted operating margin
decreased 40 basis points. The solid volume growth in 2013 was largely offset by reductions in revenue per piece, leading to
only slight growth in revenue. The net impact of fuel (fuel surcharge revenue decreased at a faster rate than fuel expense) as
well as currency remeasurement and translation losses combined to decrease operating profit by $219 million when comparing
2013 with 2012. The combination of low revenue growth and the adverse impact of fuel and currency led to the reduction in
adjusted operating margin.
2012 compared to 2011
Adjusted operating margin declined 40 basis points in 2012 compared with 2011, as the product mix shift from our
premium express products to our standard products in 2012 reduced margins in this segment. Additionally, the volume declines
in certain key transcontinental trade lanes during portions of 2012 also adversely impacted margins, since these routes have a
larger cost infrastructure (relative to the remainder of the International Package segment) to support the air express volume in
each region. These factors were mitigated, however, from benefits derived from air network adjustments, cost containment
programs and the positive impact from foreign currency exchange rate fluctuations. As a result, we experienced a 3.7% decline
in adjusted operating profit in 2012 compared with 2011.