UPS 2013 Annual Report Download - page 38
Download and view the complete annual report
Please find page 38 of the 2013 UPS annual report below. You can navigate through the pages in the report by either clicking on the pages listed below, or by using the keyword search tool below to find specific information within the annual report.-
 1
1 -
2
-
3
-
4
-
5
-
6
-
7
-
8
-
9
-
10
-
11
-
12
-
13
-
14
-
15
-
16
-
17
-
18
-
19
-
20
-
21
-
22
-
23
-
24
-
25
-
26
-
27
-
 28
28 -
 29
29 -
 30
30 -
 31
31 -
 32
32 -
 33
33 -
 34
34 -
 35
35 -
 36
36 -
 37
37 -
 38
38 -
 39
39 -
 40
40 -
 41
41 -
 42
42 -
 43
43 -
 44
44 -
 45
45 -
 46
46 -
 47
47 -
 48
48 -
49
-
50
-
51
-
52
-
53
-
54
-
55
-
56
-
57
-
58
-
59
-
60
-
61
-
62
-
63
-
64
-
65
-
66
-
67
-
68
-
69
-
70
-
71
-
72
-
73
-
74
-
75
-
76
-
77
-
78
-
79
-
80
-
81
-
82
-
83
-
84
-
85
-
86
-
87
-
88
-
89
-
90
-
91
-
92
-
93
-
94
-
95
-
96
-
97
-
98
-
99
-
100
-
101
-
102
-
103
-
104
-
105
-
106
-
107
-
108
-
109
-
110
-
111
-
112
-
113
-
114
-
115
-
116
-
117
-
118
-
119
-
120
-
121
-
122
-
123
-
124
-
125
-
126
-
127
-
128
-
129
-
130
-
131
-
132
-
133
-
134
-
135
-
136
 |
 |
UNITED PARCEL SERVICE, INC. AND SUBSIDIARIES
MANAGEMENT'S DISCUSSION AND ANALYSIS OF FINANCIAL CONDITION AND
RESULTS OF OPERATIONS
26
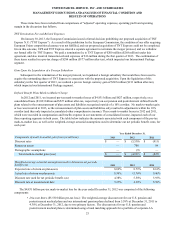
bonds. In 2012, financial institutions comprised a smaller portion of our corporate AA bond portfolio relative to
2011, largely due to credit downgrades of several large financial institutions in 2012. Additionally, credit spreads
on AA-rated 30-year bonds declined in 2012. These changes in the composition of our bond portfolio mix and the
compression in credit spreads were the primary factors resulting in the 120 basis point decline in the weighted-
average discount rate in 2012 relative to 2011.
• Return on Assets ($708 million pre-tax gain): Our expected rate of return on U.S. pension and postretirement
medical plan assets is developed taking into consideration: (1) historical plan asset returns over long-term periods,
(2) current market conditions, and (3) the mix of asset classes in our investment portfolio. We review the
expected rate of return on an annual basis and revise it as appropriate. In 2012, the actual rate of return on plan
assets of 11.76% exceeded our expected rate of return of 8.71%, primarily due to strong gains in the world equity
markets.
• Demographic Assumptions ($9 million pre-tax loss): This represents the difference between actual and estimated
demographic factors, including items such as health care cost trends, mortality rates and compensation rate
increases.
Multiemployer Pension Plan Withdrawal Charge
In 2012, we recognized an $896 million pre-tax charge ($559 million after-tax) for the establishment of a withdrawal
liability related to our withdrawal from the New England Teamsters and Trucking Industry Pension Fund ("New England
Pension Fund"), a multiemployer pension plan. This charge was recorded in compensation and benefits expense in our
statements of consolidated income, and impacted our U.S. Domestic Package segment.
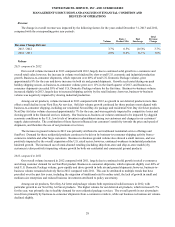
Gains on Real Estate Transactions
In 2011, we recognized a net $33 million pre-tax gain ($20 million after-tax) on a consolidated basis on certain real estate
transactions (consisting of a $48 million pre-tax gain in our Supply Chain & Freight segment, and a $15 million pre-tax loss in
our U.S. Domestic Package segment). The gains and losses associated with these transactions are recorded in other operating
expenses in our statements of consolidated income.
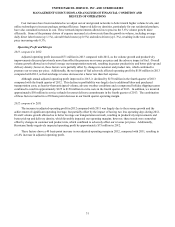
Results of Operations—Segment Review
The results and discussions that follow are reflective of how our executive management monitors the performance of our
reporting segments. We supplement the reporting of our financial information determined under generally accepted accounting
principles (“GAAP”) with certain non-GAAP financial measures, including operating profit, operating margin, pre-tax income,
net income and earnings per share adjusted for the non-comparable items discussed previously. We believe that these adjusted
measures provide meaningful information to assist investors and analysts in understanding our financial results and assessing
our prospects for future performance. We believe these adjusted financial measures are important indicators of our recurring
results of operations because they exclude items that may not be indicative of, or are unrelated to, our core operating results,
and provide a better baseline for analyzing trends in our underlying businesses. Additionally, these adjusted financial measures
are used internally by management for the determination of incentive compensation awards, business unit operating
performance analysis, and business unit resource allocation.
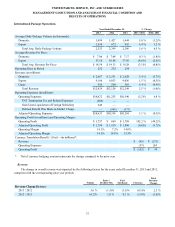
As discussed in our "Critical Accounting Policies and Estimates", we recognize changes in the fair value of plan assets
and net actuarial gains and losses in excess of a 10% corridor immediately as part of net periodic benefit cost. In our results of
operations and the discussions that follow, we have presented adjusted operating expenses, adjusted operating profit and
adjusted operating margin excluding the portion of net periodic benefit cost represented by the gains and losses recognized in
excess of the 10% corridor. This adjusted net periodic benefit cost is comparable to the accounting for our defined benefit plans
in our quarterly reporting under U.S. GAAP, and reflects assumptions utilizing the expected return on plan assets and the
discount rate used for determining net periodic benefit cost (the non-adjusted net periodic benefit cost reflects the actual return
on plan assets and the discount rate used for measuring the projected benefit obligation). We believe this adjusted net periodic
benefit cost provides important supplemental information that reflects the anticipated long-term cost of our defined benefit
plans, and provides a benchmark for historical defined benefit cost trends that can be used to better compare year-to-year
financial performance without considering the short-term impact of changes in market interest rates, equity prices, and similar
factors.