UPS 2013 Annual Report Download - page 43
Download and view the complete annual report
Please find page 43 of the 2013 UPS annual report below. You can navigate through the pages in the report by either clicking on the pages listed below, or by using the keyword search tool below to find specific information within the annual report.-
 1
1 -
2
-
3
-
4
-
5
-
6
-
7
-
8
-
9
-
10
-
11
-
12
-
13
-
14
-
15
-
16
-
17
-
18
-
19
-
20
-
21
-
22
-
23
-
24
-
25
-
26
-
27
-
28
-
29
-
30
-
31
-
32
-
 33
33 -
 34
34 -
 35
35 -
 36
36 -
 37
37 -
 38
38 -
 39
39 -
 40
40 -
 41
41 -
 42
42 -
 43
43 -
 44
44 -
 45
45 -
 46
46 -
 47
47 -
 48
48 -
 49
49 -
 50
50 -
 51
51 -
 52
52 -
 53
53 -
54
-
55
-
56
-
57
-
58
-
59
-
60
-
61
-
62
-
63
-
64
-
65
-
66
-
67
-
68
-
69
-
70
-
71
-
72
-
73
-
74
-
75
-
76
-
77
-
78
-
79
-
80
-
81
-
82
-
83
-
84
-
85
-
86
-
87
-
88
-
89
-
90
-
91
-
92
-
93
-
94
-
95
-
96
-
97
-
98
-
99
-
100
-
101
-
102
-
103
-
104
-
105
-
106
-
107
-
108
-
109
-
110
-
111
-
112
-
113
-
114
-
115
-
116
-
117
-
118
-
119
-
120
-
121
-
122
-
123
-
124
-
125
-
126
-
127
-
128
-
129
-
130
-
131
-
132
-
133
-
134
-
135
-
136
 |
 |
UNITED PARCEL SERVICE, INC. AND SUBSIDIARIES
MANAGEMENT'S DISCUSSION AND ANALYSIS OF FINANCIAL CONDITION AND
RESULTS OF OPERATIONS
31
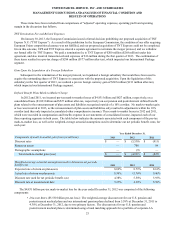
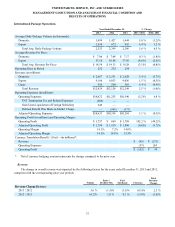
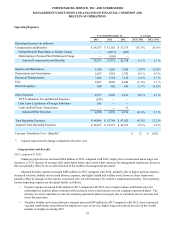
Cost increases have been moderated as we adjust our air and ground networks to better match higher volume levels, and
utilize technology to increase package sorting efficiency. Improved delivery densities, particularly for our residential products,
have also contained increases in cost. These network improvements allowed us to process the 3.6% volume growth more
efficiently. Some of the primary drivers of expense increased at a slower rate than the growth in volume, including average
daily direct labor hours (up 1.1%), aircraft block hours (up 0.5%) and miles driven (up 1.3%), resulting in the total cost per
piece increasing only 0.3%.
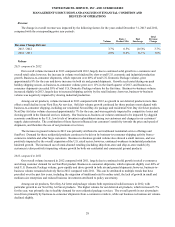
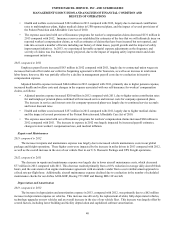
Operating Profit and Margin
2013 compared to 2012
Adjusted operating profit increased $71 million in 2013 compared with 2012, as the volume growth and productivity
improvements discussed previously more than offset the pressure on revenue per piece and the adverse impact of fuel. Overall
volume growth allowed us to better leverage our transportation network, resulting in greater productivity and better pick-up and
delivery density; however, these factors were partially offset by changes in customer and product mix, which combined to
pressure our revenue per piece. Additionally, the net impact of fuel adversely affected operating profit by $158 million in 2013
compared with 2012, as fuel surcharge revenue decreased at a faster rate than fuel expense.
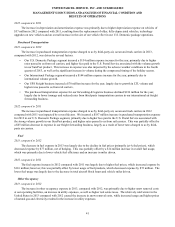
Although annual adjusted operating profit improved in 2013, it declined by $178 million in the fourth quarter of 2013
compared with the fourth quarter of 2012. This decline in profitability was largely due to additional labor and purchased
transportation costs, as heavier-than-anticipated volume, adverse weather conditions and a compressed holiday shipping season
combined to result in approximately $125 to $150 million in extra costs in the fourth quarter of 2013. In addition, we incurred
approximately $50 million in service refunds for unmet delivery commitments in the fourth quarter of 2013. The combination
of these factors resulted in a 250 basis point decrease in our fourth quarter operating margin.
2012 compared to 2011
The increase in adjusted operating profit in 2012 compared with 2011 was largely due to the revenue growth and the
achievement of significant operating leverage, but partially offset by the impact of having two less operating days during 2012.
Overall volume growth allowed us to better leverage our transportation network, resulting in productivity improvements and
better pick-up and delivery density, which favorably impacted our operating margins; however, these trends were somewhat
offset by changes in customer and product mix, which combined to adversely affect our revenue per piece. Additionally,
Hurricane Sandy negatively impacted operating profit by approximately $75 million in 2012.
These factors drove a 40 basis point increase in our adjusted operating margin in 2012, compared with 2011, resulting in
a 6.4% increase in adjusted operating profit.