UPS 2013 Annual Report Download - page 115
Download and view the complete annual report
Please find page 115 of the 2013 UPS annual report below. You can navigate through the pages in the report by either clicking on the pages listed below, or by using the keyword search tool below to find specific information within the annual report.-
 1
1 -
2
-
3
-
4
-
5
-
6
-
7
-
8
-
9
-
10
-
11
-
12
-
13
-
14
-
15
-
16
-
17
-
18
-
19
-
20
-
21
-
22
-
23
-
24
-
25
-
26
-
27
-
28
-
29
-
30
-
31
-
32
-
33
-
34
-
35
-
36
-
37
-
38
-
39
-
40
-
41
-
42
-
43
-
44
-
45
-
46
-
47
-
48
-
49
-
50
-
51
-
52
-
53
-
54
-
55
-
56
-
57
-
58
-
59
-
60
-
61
-
62
-
63
-
64
-
65
-
66
-
67
-
68
-
69
-
70
-
71
-
72
-
73
-
74
-
75
-
76
-
77
-
78
-
79
-
80
-
81
-
82
-
83
-
84
-
85
-
86
-
87
-
88
-
89
-
90
-
91
-
92
-
93
-
94
-
95
-
96
-
97
-
98
-
99
-
100
-
101
-
102
-
103
-
104
-
 105
105 -
 106
106 -
 107
107 -
 108
108 -
 109
109 -
 110
110 -
 111
111 -
 112
112 -
 113
113 -
 114
114 -
 115
115 -
 116
116 -
 117
117 -
 118
118 -
 119
119 -
 120
120 -
 121
121 -
 122
122 -
 123
123 -
 124
124 -
 125
125 -
126
-
127
-
128
-
129
-
130
-
131
-
132
-
133
-
134
-
135
-
136
 |
 |

UNITED PARCEL SERVICE, INC. AND SUBSIDIARIES
NOTES TO CONSOLIDATED FINANCIAL STATEMENTS
103
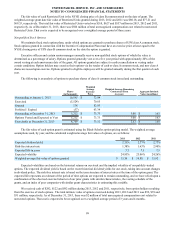
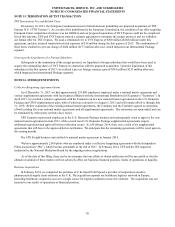
Our effective tax rate increased to 34.5% in 2013, compared with 17.1% in 2012, primarily due to an increase in total
pre-tax income and the decrease in U.S. Federal and state tax credits relative to total pre-tax income. The impact of these
factors was partially offset by a portion of the gain from liquidating a foreign subsidiary in early 2013 not being taxable (see
note 15).
Beginning in 2012, we were granted a tax incentive for certain of our non-U.S. operations, which is effective through
December 31, 2017 and may be extended through December 31, 2022 if additional requirements are satisfied. The tax
incentive is conditional upon our meeting specific employment and investment thresholds. The impact of this tax incentive
decreased non-U.S. tax expense by $20 million ($0.02 per share) and $22 million ($0.02 per share) for 2013 and 2012,
respectively.
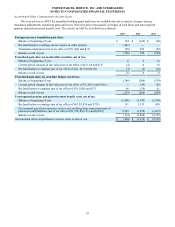
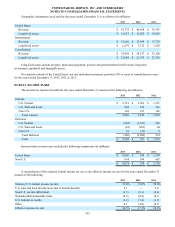
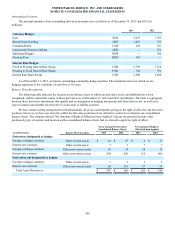
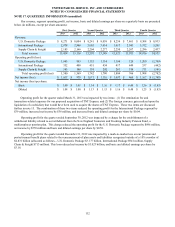
Deferred tax liabilities and assets are comprised of the following at December 31 (in millions):
2013 2012
Property, plant and equipment $ (3,613) $ (3,624)
Goodwill and intangible assets (1,116)(1,035)
Other (651)(617)
Deferred tax liabilities (5,380)(5,276)
Pension and postretirement benefits 3,086 4,608
Loss and credit carryforwards (non-U.S. and state) 279 258
Insurance reserves 765 737
Vacation pay accrual 224 209
Stock compensation 70 159
Other 709 708
Deferred tax assets 5,133 6,679
Deferred tax assets valuation allowance (251)(220)
Deferred tax asset (net of valuation allowance) 4,882 6,459
Net deferred tax asset (liability) $ (498) $ 1,183
Amounts recognized in the consolidated balance sheets:
Current deferred tax assets $ 684 $ 583
Current deferred tax liabilities (included in other current liabilities) (48)(36)
Non-current deferred tax assets 110 684
Non-current deferred tax liabilities (1,244)(48)
Net deferred tax asset (liability) $ (498) $ 1,183
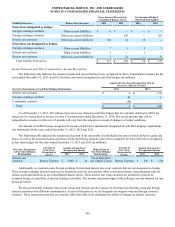
The valuation allowance increased by $31, $15 and $2 million during the years ended December 31, 2013, 2012 and
2011, respectively.
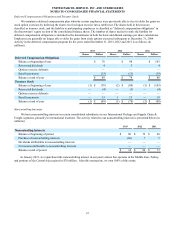
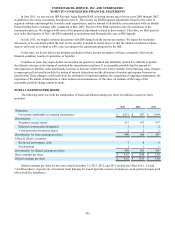
We have U.S. state and local operating loss and credit carryforwards as follows (in millions):
2013 2012
U.S. state and local operating loss carryforwards $ 546 $ 608
U.S. state and local credit carryforwards $ 42 $ 61
The operating loss carryforwards expire at varying dates through 2033. The state credits can be carried forward for
periods ranging from three years to indefinitely.