UPS 2013 Annual Report Download - page 89
Download and view the complete annual report
Please find page 89 of the 2013 UPS annual report below. You can navigate through the pages in the report by either clicking on the pages listed below, or by using the keyword search tool below to find specific information within the annual report.-
 1
1 -
2
-
3
-
4
-
5
-
6
-
7
-
8
-
9
-
10
-
11
-
12
-
13
-
14
-
15
-
16
-
17
-
18
-
19
-
20
-
21
-
22
-
23
-
24
-
25
-
26
-
27
-
28
-
29
-
30
-
31
-
32
-
33
-
34
-
35
-
36
-
37
-
38
-
39
-
40
-
41
-
42
-
43
-
44
-
45
-
46
-
47
-
48
-
49
-
50
-
51
-
52
-
53
-
54
-
55
-
56
-
57
-
58
-
59
-
60
-
61
-
62
-
63
-
64
-
65
-
66
-
67
-
68
-
69
-
70
-
71
-
72
-
73
-
74
-
75
-
76
-
77
-
78
-
 79
79 -
 80
80 -
 81
81 -
 82
82 -
 83
83 -
 84
84 -
 85
85 -
 86
86 -
 87
87 -
 88
88 -
 89
89 -
 90
90 -
 91
91 -
 92
92 -
 93
93 -
 94
94 -
 95
95 -
 96
96 -
 97
97 -
 98
98 -
 99
99 -
100
-
101
-
102
-
103
-
104
-
105
-
106
-
107
-
108
-
109
-
110
-
111
-
112
-
113
-
114
-
115
-
116
-
117
-
118
-
119
-
120
-
121
-
122
-
123
-
124
-
125
-
126
-
127
-
128
-
129
-
130
-
131
-
132
-
133
-
134
-
135
-
136
 |
 |

UNITED PARCEL SERVICE, INC. AND SUBSIDIARIES
NOTES TO CONSOLIDATED FINANCIAL STATEMENTS
77
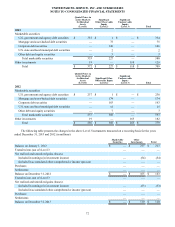
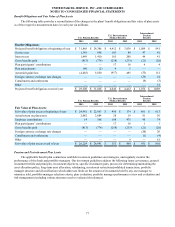
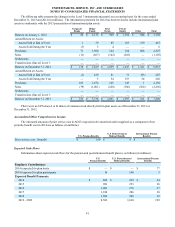
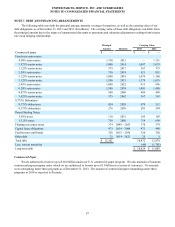
Benefit Obligations and Fair Value of Plan Assets
The following table provides a reconciliation of the changes in the plans’ benefit obligations and fair value of plan assets
as of the respective measurement dates in each year (in millions).
U.S. Pension Benefits U.S. Postretirement
Medical Benefits
International
Pension
Benefits
2013 2012 2013 2012 2013 2012
Benefit Obligations:
Projected benefit obligation at beginning of year $ 31,868 $ 24,386 $ 4,412 $ 3,836 $ 1,089 $ 841
Service cost 1,349 998 103 89 47 41
Interest cost 1,449 1,410 185 208 44 41
Gross benefits paid (813) (774)(258)(233)(21)(20)
Plan participants’ contributions — — 17 16 4 4
Plan amendments 140 (2) 4 1 — —
Actuarial (gain)/loss (4,485) 5,850 (417) 495 (55) 112
Foreign currency exchange rate changes — — — — (26) 24
Curtailments and settlements — — — — (6)(5)
Other — — — — — 51
Projected benefit obligation at end of year $ 29,508 $ 31,868 $ 4,046 $ 4,412 $ 1,076 $ 1,089
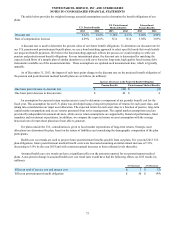
U.S. Pension Benefits U.S. Postretirement
Medical Benefits
International
Pension
Benefits
2013 2012 2013 2012 2013 2012
Fair Value of Plan Assets:
Fair value of plan assets at beginning of year $ 24,941 $ 22,663 $ 460 $ 174 $ 801 $ 613
Actual return on plan assets 2,082 2,684 28 19 81 56
Employer contributions 14 368 108 475 90 74
Plan participants’ contributions — — 17 16 1 1
Gross benefits paid (813) (774)(258)(233)(21)(20)
Foreign currency exchange rate changes — — — — (20) 20
Curtailments and settlements — — — — (1)(4)
Other — — — 9 — 61
Fair value of plan assets at end of year $ 26,224 $ 24,941 $ 355 $ 460 $ 931 $ 801
Pension and Postretirement Plan Assets
The applicable benefit plan committees establish investment guidelines and strategies, and regularly monitor the
performance of the funds and portfolio managers. Our investment guidelines address the following items: governance, general
investment beliefs and principles, investment objectives, specific investment goals, process for determining/maintaining the
asset allocation policy, long-term asset allocation, rebalancing, investment restrictions/prohibited transactions, portfolio
manager structure and diversification (which addresses limits on the amount of investments held by any one manager to
minimize risk), portfolio manager selection criteria, plan evaluation, portfolio manager performance review and evaluation and
risk management (including various measures used to evaluate risk tolerance).