UPS 2013 Annual Report Download - page 82
Download and view the complete annual report
Please find page 82 of the 2013 UPS annual report below. You can navigate through the pages in the report by either clicking on the pages listed below, or by using the keyword search tool below to find specific information within the annual report.-
 1
1 -
2
-
3
-
4
-
5
-
6
-
7
-
8
-
9
-
10
-
11
-
12
-
13
-
14
-
15
-
16
-
17
-
18
-
19
-
20
-
21
-
22
-
23
-
24
-
25
-
26
-
27
-
28
-
29
-
30
-
31
-
32
-
33
-
34
-
35
-
36
-
37
-
38
-
39
-
40
-
41
-
42
-
43
-
44
-
45
-
46
-
47
-
48
-
49
-
50
-
51
-
52
-
53
-
54
-
55
-
56
-
57
-
58
-
59
-
60
-
61
-
62
-
63
-
64
-
65
-
66
-
67
-
68
-
69
-
70
-
71
-
 72
72 -
 73
73 -
 74
74 -
 75
75 -
 76
76 -
 77
77 -
 78
78 -
 79
79 -
 80
80 -
 81
81 -
 82
82 -
 83
83 -
 84
84 -
 85
85 -
 86
86 -
 87
87 -
 88
88 -
 89
89 -
 90
90 -
 91
91 -
 92
92 -
93
-
94
-
95
-
96
-
97
-
98
-
99
-
100
-
101
-
102
-
103
-
104
-
105
-
106
-
107
-
108
-
109
-
110
-
111
-
112
-
113
-
114
-
115
-
116
-
117
-
118
-
119
-
120
-
121
-
122
-
123
-
124
-
125
-
126
-
127
-
128
-
129
-
130
-
131
-
132
-
133
-
134
-
135
-
136
 |
 |

UNITED PARCEL SERVICE, INC. AND SUBSIDIARIES
NOTES TO CONSOLIDATED FINANCIAL STATEMENTS
70
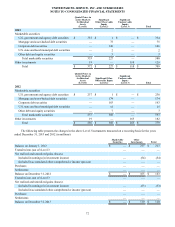
Cost Unrealized
Gains Unrealized
Losses Estimated
Fair Value
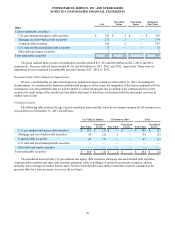
2012
Current marketable securities:
U.S. government and agency debt securities $ 236 $ 2 $ — $ 238
Mortgage and asset-backed debt securities 171 3 — 174
Corporate debt securities 158 5 — 163
U.S. state and local municipal debt securities 15 — — 15
Other debt and equity securities 7 — — 7
Total marketable securities $ 587 $ 10 $ — $ 597
The gross realized gains on sales of marketable securities totaled $11, $15 and $49 million in 2013, 2012, and 2011,
respectively. The gross realized losses totaled $6, $6 and $20 million in 2013, 2012, and 2011, respectively. There were no
impairment losses recognized on marketable securities during 2013, 2012 or 2011.
Investment Other-Than-Temporary Impairments
We have concluded that no other-than-temporary impairment losses existed as of December 31, 2013. In making this
determination, we considered the financial condition and prospects of the issuer, the magnitude of the losses compared with the
investments’ cost, the probability that we will be unable to collect all amounts due according to the contractual terms of the
security, the credit rating of the security and our ability and intent to hold these investments until the anticipated recovery in
market value occurs.
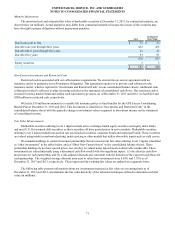
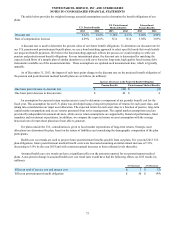
Unrealized Losses
The following table presents the age of gross unrealized losses and fair value by investment category for all securities in a
loss position as of December 31, 2013 (in millions):
Less Than 12 Months 12 Months or More Total
Fair Value Unrealized
Losses Fair Value Unrealized
Losses Fair Value Unrealized
Losses
U.S. government and agency debt securities $ 183 $ (1) $ — $ — $ 183 $ (1)
Mortgage and asset-backed debt securities 50 (2) 4 — 54 (2)
Corporate debt securities 47 (1) — — 47 (1)
U.S. state and local municipal debt securities ——————
Other debt and equity securities ——————
Total marketable securities $ 280 $ (4) $ 4 $ — $ 284 $ (4)
The unrealized losses for the U.S. government and agency debt securities, mortgage and asset-backed debt securities,
corporate debt securities and other debt securities primarily relate to holdings of various fixed income securities, and are
primarily due to changes in market interest rates. We have both the intent and ability to hold the securities contained in the
previous table for a time necessary to recover the cost basis.