UPS 2013 Annual Report Download - page 52
Download and view the complete annual report
Please find page 52 of the 2013 UPS annual report below. You can navigate through the pages in the report by either clicking on the pages listed below, or by using the keyword search tool below to find specific information within the annual report.-
 1
1 -
2
-
3
-
4
-
5
-
6
-
7
-
8
-
9
-
10
-
11
-
12
-
13
-
14
-
15
-
16
-
17
-
18
-
19
-
20
-
21
-
22
-
23
-
24
-
25
-
26
-
27
-
28
-
29
-
30
-
31
-
32
-
33
-
34
-
35
-
36
-
37
-
38
-
39
-
40
-
41
-
 42
42 -
 43
43 -
 44
44 -
 45
45 -
 46
46 -
 47
47 -
 48
48 -
 49
49 -
 50
50 -
 51
51 -
 52
52 -
 53
53 -
 54
54 -
 55
55 -
 56
56 -
 57
57 -
 58
58 -
 59
59 -
 60
60 -
 61
61 -
 62
62 -
63
-
64
-
65
-
66
-
67
-
68
-
69
-
70
-
71
-
72
-
73
-
74
-
75
-
76
-
77
-
78
-
79
-
80
-
81
-
82
-
83
-
84
-
85
-
86
-
87
-
88
-
89
-
90
-
91
-
92
-
93
-
94
-
95
-
96
-
97
-
98
-
99
-
100
-
101
-
102
-
103
-
104
-
105
-
106
-
107
-
108
-
109
-
110
-
111
-
112
-
113
-
114
-
115
-
116
-
117
-
118
-
119
-
120
-
121
-
122
-
123
-
124
-
125
-
126
-
127
-
128
-
129
-
130
-
131
-
132
-
133
-
134
-
135
-
136
 |
 |
UNITED PARCEL SERVICE, INC. AND SUBSIDIARIES
MANAGEMENT'S DISCUSSION AND ANALYSIS OF FINANCIAL CONDITION AND
RESULTS OF OPERATIONS
40
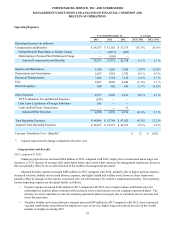
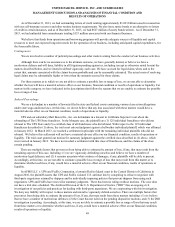
• Health and welfare costs increased $182 million in 2013 compared with 2012, largely due to increased contribution
rates to multiemployer plans, higher medical claims in UPS-sponsored plans, and the impact of several provisions of
the Patient Protection and Affordable Care Act of 2010.
• The expense associated with our self-insurance programs for worker’s compensation claims decreased $131 million in
2013 compared with 2012. Insurance reserves are established for estimates of the loss that we will ultimately incur on
reported worker's compensation claims, as well as estimates of claims that have been incurred but not reported, and
take into account a number of factors including our history of claim losses, payroll growth and the impact of safety
improvement initiatives. In 2013, we experienced favorable actuarial expense adjustments as the frequency and
severity of claims was less than previously projected, due to the impact of ongoing safety improvement and claim
management initiatives.
2012 compared to 2011
Employee payroll costs increased $183 million in 2012 compared with 2011, largely due to contractual union wage rate
increases that took effect under our collective bargaining agreement with the Teamsters, as well as an increase in total union
labor hours; however, this was partially offset by a decline in management payroll costs due to a reduction in incentive
compensation expense.
Adjusted benefits expense increased $444 million in 2012 compared with 2011, primarily due to higher pension expense,
increased health and welfare costs and changes in the expense associated with our self-insurance for workers' compensation
claims, as follows:
• Adjusted pension expense increased $200 million in 2012 compared with 2011, due to higher union contribution rates
for multiemployer pension plans combined with increased service and interest costs for company-sponsored plans.
The increase in service and interest costs for company-sponsored plans was largely due to continued service accruals
and lower discount rates.
• Health and welfare costs increased $157 million in 2012 compared with 2011, largely due to higher medical claims
and the impact of several provisions of the Patient Protection and Affordable Care Act of 2010.
• The expense associated with our self-insurance programs for workers' compensation claims increased $60 million in
2012 compared with 2011. The increase in expense in 2012 was largely impacted by increased payroll estimates,
changes in state workers' compensation laws, and medical inflation.
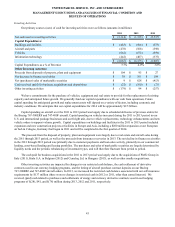
Repairs and Maintenance
2013 compared to 2012
The increase in repairs and maintenance expense was largely due to increased vehicle maintenance costs in our global
package and freight operations. These higher costs were impacted by the increase in miles driven in 2013 compared with 2012,
as well as the overall increase in the size of our vehicle fleet in our U.S. Domestic Package and UPS Freight operations.
2012 compared to 2011
The decrease in repairs and maintenance expense was largely due to lower aircraft maintenance costs, which decreased
$77 million in 2012 compared with 2011. This decrease resulted primarily from a 0.8% reduction in average daily aircraft block
hours, and the conversion of an engine maintenance agreement with an outside vendor from a cost reimbursement approach to
a fixed rate per flight hour. Additionally, aircraft maintenance expense declined due to a reduction in the number of scheduled
maintenance checks for our Airbus A300-600F, Boeing 757-200F and Boeing MD-11F aircraft.
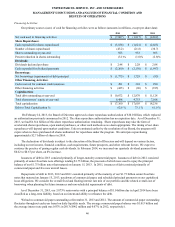
Depreciation and Amortization
2013 compared to 2012
The increase in depreciation and amortization expense in 2013, compared with 2012, was primarily due to a $62 million
increase in depreciation expense on vehicles. This increase was driven by the replacement of older, fully-depreciated vehicles,
technology upgrades on new vehicles and an overall increase in the size of our vehicle fleet. This increase was largely offset by
several factors, including lower building and facility depreciation and capitalized software amortization.