UPS 2013 Annual Report Download - page 37
Download and view the complete annual report
Please find page 37 of the 2013 UPS annual report below. You can navigate through the pages in the report by either clicking on the pages listed below, or by using the keyword search tool below to find specific information within the annual report.-
 1
1 -
2
-
3
-
4
-
5
-
6
-
7
-
8
-
9
-
10
-
11
-
12
-
13
-
14
-
15
-
16
-
17
-
18
-
19
-
20
-
21
-
22
-
23
-
24
-
25
-
26
-
 27
27 -
 28
28 -
 29
29 -
 30
30 -
 31
31 -
 32
32 -
 33
33 -
 34
34 -
 35
35 -
 36
36 -
 37
37 -
 38
38 -
 39
39 -
 40
40 -
 41
41 -
 42
42 -
 43
43 -
 44
44 -
 45
45 -
 46
46 -
 47
47 -
48
-
49
-
50
-
51
-
52
-
53
-
54
-
55
-
56
-
57
-
58
-
59
-
60
-
61
-
62
-
63
-
64
-
65
-
66
-
67
-
68
-
69
-
70
-
71
-
72
-
73
-
74
-
75
-
76
-
77
-
78
-
79
-
80
-
81
-
82
-
83
-
84
-
85
-
86
-
87
-
88
-
89
-
90
-
91
-
92
-
93
-
94
-
95
-
96
-
97
-
98
-
99
-
100
-
101
-
102
-
103
-
104
-
105
-
106
-
107
-
108
-
109
-
110
-
111
-
112
-
113
-
114
-
115
-
116
-
117
-
118
-
119
-
120
-
121
-
122
-
123
-
124
-
125
-
126
-
127
-
128
-
129
-
130
-
131
-
132
-
133
-
134
-
135
-
136
 |
 |

UNITED PARCEL SERVICE, INC. AND SUBSIDIARIES
MANAGEMENT'S DISCUSSION AND ANALYSIS OF FINANCIAL CONDITION AND
RESULTS OF OPERATIONS
25
These items have been excluded from comparisons of "adjusted" operating expenses, operating profit and operating
margin in the discussion that follows.
TNT Termination Fee and Related Expenses
On January 30, 2013, the European Commission issued a formal decision prohibiting our proposed acquisition of TNT
Express N.V. ("TNT Express"). As a result of the prohibition by the European Commission, the condition of our offer requiring
European Union competition clearance was not fulfilled, and our proposed acquisition of TNT Express could not be completed.
Given this outcome, UPS and TNT Express entered a separate agreement to terminate the merger protocol, and we withdrew
our formal offer for TNT Express. We paid a termination fee to TNT Express of €200 million ($268 million) under this
agreement, and also incurred transaction-related expenses of $16 million during the first quarter of 2013. The combination of
these items resulted in a pre-tax charge of $284 million ($177 million after-tax), which impacted our International Package
segment.
Gain Upon the Liquidation of a Foreign Subsidiary
Subsequent to the termination of the merger protocol, we liquidated a foreign subsidiary that would have been used to
acquire the outstanding shares of TNT Express in connection with the proposed acquisition. Upon the liquidation of this
subsidiary in the first quarter of 2013, we realized a pre-tax foreign currency gain of $245 million ($213 million after-tax),
which impacted our International Package segment.
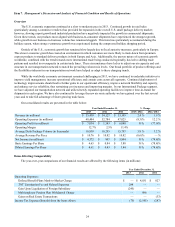
Defined Benefit Plans Mark-to-Market Charge
In 2012 and 2011, we incurred pre-tax mark-to-market losses of $4.831 billion and $827 million, respectively, on a
consolidated basis ($3.023 billion and $527 million after-tax, respectively) on our pension and postretirement defined benefit
plans related to the remeasurement of plan assets and liabilities recognized outside of a 10% corridor. No mark-to-market gain
or loss was incurred in 2013, as the remeasurement of plan assets and liabilities only resulted in adjustments within the 10%
corridor (and thus only impacted accumulated other comprehensive income). These mark-to-market losses in 2012 and 2011,
which were recorded in compensation and benefits expense in our statements of consolidated income, impacted each of our
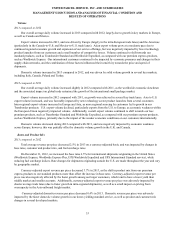
three reporting segments in both years. The table below indicates the amounts associated with each component of the pre-tax
mark-to-market loss, as well as the weighted-average actuarial assumptions used to determine our net periodic benefit costs, for
each year:
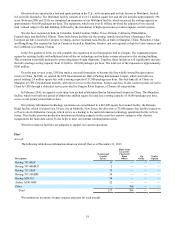
Year Ended December 31,
Components of mark-to-market gain (loss) (in millions) 2013 2012 2011
Discount rates $ — $ (5,530) $ (911)
Return on assets — 708 84
Demographic assumptions — (9) —
Total mark-to-market gain (loss) $ — $ (4,831) $ (827)
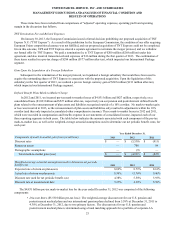
Weighted-average actuarial assumptions used to determine net periodic
benefit cost 2013 2012 2011
Expected rate of return on plan assets 8.69% 8.71% 8.61%
Actual rate of return on plan assets 8.36% 11.76% 9.46%
Discount rate used for net periodic benefit cost 4.38% 5.58% 5.93%
Discount rate at measurement date 5.27% 4.38% 5.58%
The $4.831 billion pre-tax mark-to-market loss for the year ended December 31, 2012 was comprised of the following
components:
• Discount Rates ($5.530 billion pre-tax loss): The weighted-average discount rate for our U.S. pension and
postretirement medical plans and our international pension plans declined from 5.58% at December 31, 2011 to
4.38% at December 31, 2012, due to two primary factors. The discount rate for our U.S. pension and
postretirement medical plans is determined using a bond matching approach for a portfolio of corporate AA