UPS 2013 Annual Report Download - page 68
Download and view the complete annual report
Please find page 68 of the 2013 UPS annual report below. You can navigate through the pages in the report by either clicking on the pages listed below, or by using the keyword search tool below to find specific information within the annual report.-
 1
1 -
2
-
3
-
4
-
5
-
6
-
7
-
8
-
9
-
10
-
11
-
12
-
13
-
14
-
15
-
16
-
17
-
18
-
19
-
20
-
21
-
22
-
23
-
24
-
25
-
26
-
27
-
28
-
29
-
30
-
31
-
32
-
33
-
34
-
35
-
36
-
37
-
38
-
39
-
40
-
41
-
42
-
43
-
44
-
45
-
46
-
47
-
48
-
49
-
50
-
51
-
52
-
53
-
54
-
55
-
56
-
57
-
 58
58 -
 59
59 -
 60
60 -
 61
61 -
 62
62 -
 63
63 -
 64
64 -
 65
65 -
 66
66 -
 67
67 -
 68
68 -
 69
69 -
 70
70 -
 71
71 -
 72
72 -
 73
73 -
 74
74 -
 75
75 -
 76
76 -
 77
77 -
 78
78 -
79
-
80
-
81
-
82
-
83
-
84
-
85
-
86
-
87
-
88
-
89
-
90
-
91
-
92
-
93
-
94
-
95
-
96
-
97
-
98
-
99
-
100
-
101
-
102
-
103
-
104
-
105
-
106
-
107
-
108
-
109
-
110
-
111
-
112
-
113
-
114
-
115
-
116
-
117
-
118
-
119
-
120
-
121
-
122
-
123
-
124
-
125
-
126
-
127
-
128
-
129
-
130
-
131
-
132
-
133
-
134
-
135
-
136
 |
 |

UNITED PARCEL SERVICE, INC. AND SUBSIDIARIES
MANAGEMENT'S DISCUSSION AND ANALYSIS OF FINANCIAL CONDITION AND
RESULTS OF OPERATIONS
56
Pension and Postretirement Medical Benefits
Our pension and other postretirement benefit costs are calculated using various actuarial assumptions and methodologies.
These assumptions include discount rates, health care cost trend rates, inflation, compensation increase rates, expected returns
on plan assets, mortality rates and other factors. The assumptions utilized in recording the obligations under our plans represent
our best estimates, and we believe that they are reasonable, based on information as to historical experience and performance as
well as other factors that might cause future expectations to differ from past trends.
Differences in actual experience or changes in assumptions may affect our pension and other postretirement obligations
and future expense. The primary factors contributing to actuarial gains and losses each year are (1) changes in the discount rate
used to value pension and postretirement benefit obligations as of the measurement date and (2) differences between the
expected and the actual return on plan assets.
We recognize changes in the fair value of plan assets and net actuarial gains or losses in excess of a corridor (defined as
10% of the greater of the fair value of plan assets or the plans' projected benefit obligations) in pension expense annually at
December 31st each year. The remaining components of pension expense (herein referred to as "ongoing net periodic benefit
cost"), primarily service and interest costs and the expected return on plan assets, are recorded on a quarterly basis.
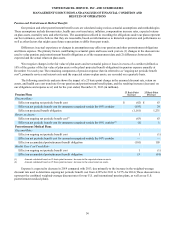
The following sensitivity analysis shows the impact of a 25 basis point change in the assumed discount rate, return on
assets, and health care cost trend rate for our pension and postretirement benefit plans, and the resulting increase (decrease) on
our obligations and expense as of, and for the year ended, December 31, 2013 (in millions).
Pension Plans 25 Basis Point
Increase 25 Basis Point
Decrease
Discount Rate:
Effect on ongoing net periodic benefit cost $ (62) $ 63
Effect on net periodic benefit cost for amounts recognized outside the 10% corridor (193) 24
Effect on projected benefit obligation (1,161) 1,231
Return on Assets:
Effect on ongoing net periodic benefit cost(1) (63) 63
Effect on net periodic benefit cost for amounts recognized outside the 10% corridor(2) (1) 1
Postretirement Medical Plans
Discount Rate:
Effect on ongoing net periodic benefit cost 1 (1)
Effect on net periodic benefit cost for amounts recognized outside the 10% corridor — —
Effect on accumulated postretirement benefit obligation (101) 105
Health Care Cost Trend Rate:
Effect on ongoing net periodic benefit cost 1 (1)
Effect on accumulated postretirement benefit obligation 13 (14)
(1) Amount calculated based on 25 basis point increase / decrease in the expected return on assets.
(2) Amount calculated based on 25 basis point increase / decrease in the actual return on assets.
Expense is expected to decrease in 2014 compared with 2013, due primarily to the increase in the weighted-average
discount rate used to determine ongoing net periodic benefit cost from 4.38% for 2013 to 5.27% for 2014 (These discount rates
represent the combined weighted-average discount rates for our U.S. and international pension plans, as well as our U.S.
postretirement medical plans).