UPS 2013 Annual Report Download - page 46
Download and view the complete annual report
Please find page 46 of the 2013 UPS annual report below. You can navigate through the pages in the report by either clicking on the pages listed below, or by using the keyword search tool below to find specific information within the annual report.-
 1
1 -
2
-
3
-
4
-
5
-
6
-
7
-
8
-
9
-
10
-
11
-
12
-
13
-
14
-
15
-
16
-
17
-
18
-
19
-
20
-
21
-
22
-
23
-
24
-
25
-
26
-
27
-
28
-
29
-
30
-
31
-
32
-
33
-
34
-
35
-
 36
36 -
 37
37 -
 38
38 -
 39
39 -
 40
40 -
 41
41 -
 42
42 -
 43
43 -
 44
44 -
 45
45 -
 46
46 -
 47
47 -
 48
48 -
 49
49 -
 50
50 -
 51
51 -
 52
52 -
 53
53 -
 54
54 -
 55
55 -
 56
56 -
57
-
58
-
59
-
60
-
61
-
62
-
63
-
64
-
65
-
66
-
67
-
68
-
69
-
70
-
71
-
72
-
73
-
74
-
75
-
76
-
77
-
78
-
79
-
80
-
81
-
82
-
83
-
84
-
85
-
86
-
87
-
88
-
89
-
90
-
91
-
92
-
93
-
94
-
95
-
96
-
97
-
98
-
99
-
100
-
101
-
102
-
103
-
104
-
105
-
106
-
107
-
108
-
109
-
110
-
111
-
112
-
113
-
114
-
115
-
116
-
117
-
118
-
119
-
120
-
121
-
122
-
123
-
124
-
125
-
126
-
127
-
128
-
129
-
130
-
131
-
132
-
133
-
134
-
135
-
136
 |
 |
UNITED PARCEL SERVICE, INC. AND SUBSIDIARIES
MANAGEMENT'S DISCUSSION AND ANALYSIS OF FINANCIAL CONDITION AND
RESULTS OF OPERATIONS
34
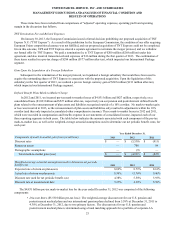
2012 compared to 2011
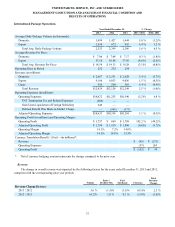
Total average revenue per piece increased 1.5% in 2012 on a currency-adjusted basis, and was impacted by base rate
increases, as well as changes in product mix and fuel surcharge rates, which are discussed below.
Currency-adjusted export revenue per piece decreased 1.3% for the year, as the shift in product mix from our premium
express products to our standard products more than offset the increase in base rates. Additionally, currency-adjusted export
revenue per piece was adversely impacted by a shortening of average trade lanes, as we experienced greater volume growth
among our lower-yielding Transborder and Trade Direct products relative to our higher-yielding transcontinental volume.
Currency-adjusted domestic revenue per piece increased 3.8% for the year, largely due to base rate increases.
On January 2, 2012, we increased the base rates 6.9% for international shipments originating in the United States
(Worldwide Express, Worldwide Express Plus, UPS Worldwide Expedited and UPS International Standard service), while
reducing the fuel surcharge indices. Rate changes for shipments originating outside the U.S. are made throughout the year and
vary by geographic market.
Fuel Surcharges
In connection with our base rate increases on December 31, 2012 and January 2, 2012, we modified the fuel surcharges
on certain U.S.-related international air services by reducing the index used to determine the fuel surcharge by 2% in each of
the two years. The fuel surcharges for air products originating outside the United States are indexed to the DOE's Gulf Coast
spot price for a gallon of kerosene-type jet fuel, while the fuel surcharges for ground products originating outside the United
States are indexed to fuel prices in the international region or country where the shipment takes place. Total international fuel
surcharge revenue decreased by $135 million in 2013, largely due to declining fuel prices and the 2% reduction in the index;
however, this was partially offset by increases in international air volume. Total international fuel surcharge revenue increased
by $11 million in 2012, due to higher fuel surcharge rates caused by increased fuel prices as well as an increase in international
air volume, but was partially offset by the 2% reduction in the index.
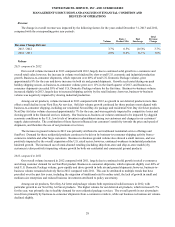
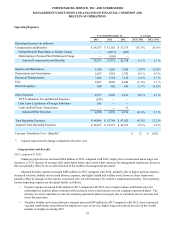
Operating Expenses
2013 compared to 2012
Overall adjusted operating expenses for the segment increased $319 million in 2013 compared with 2012. This increase
was driven by the cost of pick-up and delivery, which increased $195 million for the year, largely due to higher package
volume.
The cost of operating our international integrated air and ground network increased $111 million for the year, also largely
due to higher package volume; however, network costs were mitigated by a 0.4% reduction in average daily aircraft block hours
resulting from ongoing modifications to our air network. This was achieved even with a 6.4% increase in international export
volume and several air product service enhancements that occurred during 2013.
The remaining increases in adjusted operating expenses for the year were largely due to the costs of package sorting,
which was impacted by volume growth, and indirect operating costs, which were affected by increased expenses associated
with aviation security.
Excluding the impact of currency exchange rate changes, the total adjusted cost per piece for the segment decreased 2.7%
in 2013 compared with 2012.
2012 compared to 2011
Overall adjusted operating expenses for the segment decreased $55 million in 2012 compared with 2011. The largest
component of this decrease related to the cost of operating our international integrated air and ground network, which decreased
$117 million. This decrease primarily resulted from cost control initiatives, including a 1.8% reduction in average daily aircraft
block hours resulting from ongoing modifications to our air network. The cost of pick-up and delivery decreased $53 million,
largely due to the impact of currency exchange rate movements and in-country cost control initiatives.