UPS 2013 Annual Report Download - page 49
Download and view the complete annual report
Please find page 49 of the 2013 UPS annual report below. You can navigate through the pages in the report by either clicking on the pages listed below, or by using the keyword search tool below to find specific information within the annual report.-
 1
1 -
2
-
3
-
4
-
5
-
6
-
7
-
8
-
9
-
10
-
11
-
12
-
13
-
14
-
15
-
16
-
17
-
18
-
19
-
20
-
21
-
22
-
23
-
24
-
25
-
26
-
27
-
28
-
29
-
30
-
31
-
32
-
33
-
34
-
35
-
36
-
37
-
38
-
 39
39 -
 40
40 -
 41
41 -
 42
42 -
 43
43 -
 44
44 -
 45
45 -
 46
46 -
 47
47 -
 48
48 -
 49
49 -
 50
50 -
 51
51 -
 52
52 -
 53
53 -
 54
54 -
 55
55 -
 56
56 -
 57
57 -
 58
58 -
 59
59 -
60
-
61
-
62
-
63
-
64
-
65
-
66
-
67
-
68
-
69
-
70
-
71
-
72
-
73
-
74
-
75
-
76
-
77
-
78
-
79
-
80
-
81
-
82
-
83
-
84
-
85
-
86
-
87
-
88
-
89
-
90
-
91
-
92
-
93
-
94
-
95
-
96
-
97
-
98
-
99
-
100
-
101
-
102
-
103
-
104
-
105
-
106
-
107
-
108
-
109
-
110
-
111
-
112
-
113
-
114
-
115
-
116
-
117
-
118
-
119
-
120
-
121
-
122
-
123
-
124
-
125
-
126
-
127
-
128
-
129
-
130
-
131
-
132
-
133
-
134
-
135
-
136
 |
 |
UNITED PARCEL SERVICE, INC. AND SUBSIDIARIES
MANAGEMENT'S DISCUSSION AND ANALYSIS OF FINANCIAL CONDITION AND
RESULTS OF OPERATIONS
37
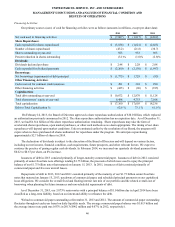
Freight revenue increased $242 million in 2013, driven by an increase in LTL revenue per hundredweight, tonnage and
average daily LTL shipments. The increase in LTL revenue per hundredweight was largely due to our focus on yield
management, as well as general rate increases averaging 5.9% that took effect on both July 16, 2012 and on June 10, 2013,
covering non-contractual shipments in the United States, Canada and Mexico. LTL fuel surcharge revenue increased by $18
million in 2013 compared with the prior year, due to changes in diesel fuel prices and overall LTL shipment volume. In
addition, our Truckload division experienced increased volume and revenue, primarily related to our dedicated and non-
dedicated service offerings.
The other businesses within Supply Chain & Freight increased revenue by $31 million in 2013, primarily due to growth at
UPS Capital, The UPS Store and UPS Customer Solutions.
2012 compared to 2011
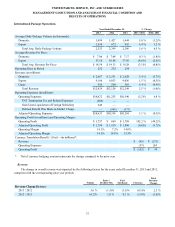
Forwarding and logistics revenue decreased $126 million in 2012 compared with 2011. Forwarding revenue decreased in
2012, primarily due to lower rates in our air forwarding business and the adverse impact of foreign currency exchange rates;
however, this was partially offset by improved tonnage in both our air and ocean forwarding businesses. The reduction in rates
in the air forwarding business was largely due to industry overcapacity in key trade lanes, particularly the Asia-outbound
market. In our logistics products, revenue increased in 2012 as we experienced robust growth in our mail services and health
care solutions. The improved revenue in our health care solutions business was driven by organic growth as well as the
December 2011 acquisition of Pieffe Group.
Freight revenue increased $77 million for the year, driven by an increase in LTL revenue per hundredweight and in gross
weight hauled; however, these factors were somewhat offset by a decline in average daily LTL shipments. The increase in LTL
revenue per hundredweight was largely due to our focus on yield management and profitable revenue growth, as well as a
general rate increase averaging 5.9% that took effect on July 16, 2012, covering non-contractual shipments in the United States,
Canada and Mexico. The decline in average daily LTL shipments in 2012 was impacted by increased competitiveness in the
LTL market and the slowdown in the U.S. economy. Fuel surcharge revenue increased by $16 million for 2012 compared with
the prior year, due to changes in diesel fuel prices and overall LTL shipment volume.
The other businesses within Supply Chain & Freight increased revenue by $57 million in 2012 compared with 2011,
primarily due to growth at The UPS Store, UPS Customer Solutions and our contract to provide domestic air transportation
services for the U.S. Postal Service.
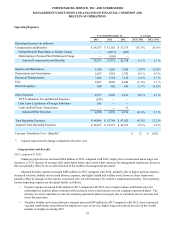
Operating Expenses
2013 compared to 2012
Forwarding and logistics adjusted operating expenses decreased $388 million in 2013 compared with 2012, due to several
factors. Purchased transportation expense declined by $236 million, primarily due to lower tonnage in our international air
freight forwarding business. Compensation and benefits expense declined by $59 million, largely due to reduced payroll costs
and lower expense for worker's compensation claims. The remaining decrease in expense resulted from lower fuel costs, bad
debt expense, and various other items.
Freight adjusted operating expenses increased $234 million in 2013, while the total cost per LTL shipment increased
2.0%. The largest component of this increase related to the cost of operating our linehaul network, which grew by $62 million,
as a result of a 3.7% average daily tonnage increase, coupled with wage and purchased transportation increases. Our Truckload
division experienced a $48 million increase in costs for the year, largely related to the expansion of our dedicated and non-
dedicated services. Pick-up and delivery costs increased $15 million as a result of higher volume and wage increases, but were
partially offset by productivity improvements. The remaining increase in expense in 2013 was impacted by increases in
pension expense and healthcare costs.
Adjusted operating expenses for the other businesses within Supply Chain & Freight decreased $4 million in 2013
compared with 2012.