UPS 2013 Annual Report Download - page 53
Download and view the complete annual report
Please find page 53 of the 2013 UPS annual report below. You can navigate through the pages in the report by either clicking on the pages listed below, or by using the keyword search tool below to find specific information within the annual report.-
 1
1 -
2
-
3
-
4
-
5
-
6
-
7
-
8
-
9
-
10
-
11
-
12
-
13
-
14
-
15
-
16
-
17
-
18
-
19
-
20
-
21
-
22
-
23
-
24
-
25
-
26
-
27
-
28
-
29
-
30
-
31
-
32
-
33
-
34
-
35
-
36
-
37
-
38
-
39
-
40
-
41
-
42
-
 43
43 -
 44
44 -
 45
45 -
 46
46 -
 47
47 -
 48
48 -
 49
49 -
 50
50 -
 51
51 -
 52
52 -
 53
53 -
 54
54 -
 55
55 -
 56
56 -
 57
57 -
 58
58 -
 59
59 -
 60
60 -
 61
61 -
 62
62 -
 63
63 -
64
-
65
-
66
-
67
-
68
-
69
-
70
-
71
-
72
-
73
-
74
-
75
-
76
-
77
-
78
-
79
-
80
-
81
-
82
-
83
-
84
-
85
-
86
-
87
-
88
-
89
-
90
-
91
-
92
-
93
-
94
-
95
-
96
-
97
-
98
-
99
-
100
-
101
-
102
-
103
-
104
-
105
-
106
-
107
-
108
-
109
-
110
-
111
-
112
-
113
-
114
-
115
-
116
-
117
-
118
-
119
-
120
-
121
-
122
-
123
-
124
-
125
-
126
-
127
-
128
-
129
-
130
-
131
-
132
-
133
-
134
-
135
-
136
 |
 |
UNITED PARCEL SERVICE, INC. AND SUBSIDIARIES
MANAGEMENT'S DISCUSSION AND ANALYSIS OF FINANCIAL CONDITION AND
RESULTS OF OPERATIONS
41
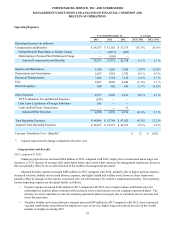
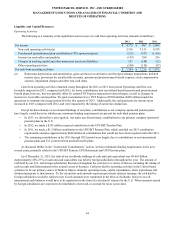
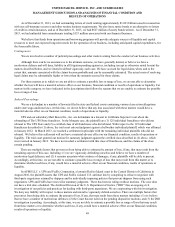
2012 compared to 2011
The increase in depreciation and amortization expense was primarily due to higher depreciation expense on vehicles of
$57 million in 2012 compared with 2011, resulting from the replacement of older, fully-depreciated vehicles, technology
upgrades on new vehicles and an overall increase in the size of our vehicle fleet in our U.S. Domestic package operations.
Purchased Transportation
2013 compared to 2012
The increase in purchased transportation expense charged to us by third-party air, ocean and truck carriers in 2013,
compared with 2012, was driven by several factors:
• Our U.S. Domestic Package segment incurred a $154 million expense increase for the year, primarily due to higher
rates passed to us from rail carriers, and higher fees paid to the U.S. Postal Service associated with the volume growth
in our SurePost product. This increase in expense was also impacted by the adverse weather conditions in the fourth
quarter of 2013, as well as the significant increase in volume during the compressed timing of the holiday season.
• Our International Package segment incurred a $144 million expense increase for the year, primarily due to
international volume growth.
• Our UPS Freight business incurred a $70 million increase for the year, largely due to growth in LTL volume and
higher rates passed to us from rail carriers.
• The purchased transportation expense for our forwarding & logistics business declined $236 million for the year,
largely due to lower tonnage and reduced rates from third-party transportation carriers in our international air freight
forwarding business.
2012 compared to 2011
The increase in purchased transportation expense charged to us by third-party air, ocean and truck carriers in 2012
compared with 2011 was impacted by several factors. We incurred a $187 million increase in purchased transportation expense
for 2012 in our U.S. Domestic Package segment, primarily due to higher fees paid to the U.S. Postal Service associated with
the strong volume growth in our SurePost product, and higher rates passed to us from rail carriers. This was partially offset by
a $65 million decrease in expense in our freight forwarding business, largely as a result of lower rates charged to us by third-
party air carriers.
Fuel
2013 compared to 2012
The decrease in fuel expense in 2013 was largely due to the decline in fuel prices (primarily jet-A fuel prices), which
decreased expense by $77 million, net of hedging. This was partially offset by a $14 million increase in overall fuel usage,
which was primarily due to lower vehicle fuel efficiency and an increase in miles driven.
2012 compared to 2011
The fuel expense increase in 2012 compared with 2011 was largely due to higher fuel prices, which increased expense by
$116 million; however, this was partially offset by lower usage of fuel products, which decreased expense by $72 million. The
lower fuel usage was largely due to the decrease in total aircraft block hours and vehicle miles driven.
Other Occupancy
2013 compared to 2012
The increase in other occupancy expense in 2013, compared with 2012, was primarily due to higher snow removal costs
at our operating facilities, an increase in utility expenses, as well as higher real estate taxes. The relatively cold winter in the
United States in 2013 compared with 2012 caused the increase in snow removal costs, while increased usage and higher prices
of natural gas and electricity resulted in the increase in utility expenses.