UPS 2013 Annual Report Download - page 4
Download and view the complete annual report
Please find page 4 of the 2013 UPS annual report below. You can navigate through the pages in the report by either clicking on the pages listed below, or by using the keyword search tool below to find specific information within the annual report.-
 1
1 -
 2
2 -
 3
3 -
 4
4 -
 5
5 -
 6
6 -
 7
7 -
 8
8 -
 9
9 -
 10
10 -
 11
11 -
 12
12 -
 13
13 -
 14
14 -
 15
15 -
16
-
17
-
18
-
19
-
20
-
21
-
22
-
23
-
24
-
25
-
26
-
27
-
28
-
29
-
30
-
31
-
32
-
33
-
34
-
35
-
36
-
37
-
38
-
39
-
40
-
41
-
42
-
43
-
44
-
45
-
46
-
47
-
48
-
49
-
50
-
51
-
52
-
53
-
54
-
55
-
56
-
57
-
58
-
59
-
60
-
61
-
62
-
63
-
64
-
65
-
66
-
67
-
68
-
69
-
70
-
71
-
72
-
73
-
74
-
75
-
76
-
77
-
78
-
79
-
80
-
81
-
82
-
83
-
84
-
85
-
86
-
87
-
88
-
89
-
90
-
91
-
92
-
93
-
94
-
95
-
96
-
97
-
98
-
99
-
100
-
101
-
102
-
103
-
104
-
105
-
106
-
107
-
108
-
109
-
110
-
111
-
112
-
113
-
114
-
115
-
116
-
117
-
118
-
119
-
120
-
121
-
122
-
123
-
124
-
125
-
126
-
127
-
128
-
129
-
130
-
131
-
132
-
133
-
134
-
135
-
136
 |
 |

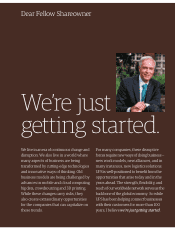
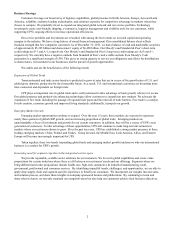
The unique network we have built means that even during
periods of economic uncertainty like we experienced in 2013,
UPS can still deliver positive results for its shareowners:
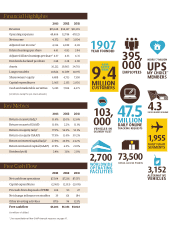
• Our customers trusted UPS with, on average, more than
16.9 million packages each day in 2013, or 4 percent more
than the year before. Most of that increase came from the
e-commerce boom, but we are also bene tting from the
signi cant investments we have made to serve
customers in fast-growing segments like healthcare and
high tech. The growth from these sectors, coupled with
the steady rebound in global trade, gives us optimism
going into 2014.
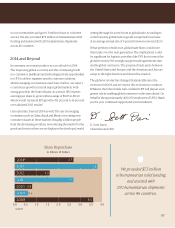
• In 2013, UPS earned $4.37 billion on $55.4 billion in
revenue. While we fell short of our earnings-per-share
goal, we still achieved new records in revenue and
earnings per share.
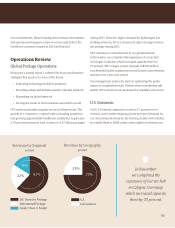
• Our International package segment earned $1.76 billion
on $12.4 billion in revenue. Adjusted operating pro t2 for
the segment declined slightly from 2012 as customers
traded down to less-expensive modes of transportation.
International package generated 22 percent of revenue
versus 17 percent a decade earlier, which re ects the
growing demand for our services around the world.
• Our free cash ow* generation remained robust, at
$5.2 billion, enabling us to raise the dividend by almost
9 percent per share in 2013. This means UPS has now
increased or maintained its dividend annually for more
than four decades. Our robust cash ow also enabled us
to fund $2.1 billion in capital expenditures and repurchase
more than $3.8 billion in shares. UPS has returned nearly
$20 billion to shareowners since 2009.
The founders of UPS built the company’s culture around the
concept of “constructive dissatisfaction,” and we live it every
day. There were some areas of our U.S. performance where we
came up short in 2013—particularly our service record during
the peak season between Thanksgiving and Christmas. While
we are grateful that a record number of customers trusted
UPS with their holiday shipments, the surge in volume over-
whelmed our system and prevented us from honoring all of
02
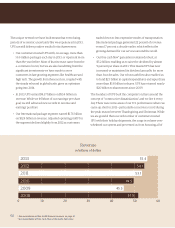
2010 49.5
2011 53.1
2012 54.1
2009 45.3
2013 55.4
Revenue
in billions of dollars
0 102030405060
2008 51.5
2 See reconciliation of Non-GAAP financial measures on page A1.
* See reconciliation of Free Cash Flow on the inside front cover.