UPS 2013 Annual Report Download - page 57
Download and view the complete annual report
Please find page 57 of the 2013 UPS annual report below. You can navigate through the pages in the report by either clicking on the pages listed below, or by using the keyword search tool below to find specific information within the annual report.-
 1
1 -
2
-
3
-
4
-
5
-
6
-
7
-
8
-
9
-
10
-
11
-
12
-
13
-
14
-
15
-
16
-
17
-
18
-
19
-
20
-
21
-
22
-
23
-
24
-
25
-
26
-
27
-
28
-
29
-
30
-
31
-
32
-
33
-
34
-
35
-
36
-
37
-
38
-
39
-
40
-
41
-
42
-
43
-
44
-
45
-
46
-
 47
47 -
 48
48 -
 49
49 -
 50
50 -
 51
51 -
 52
52 -
 53
53 -
 54
54 -
 55
55 -
 56
56 -
 57
57 -
 58
58 -
 59
59 -
 60
60 -
 61
61 -
 62
62 -
 63
63 -
 64
64 -
 65
65 -
 66
66 -
 67
67 -
68
-
69
-
70
-
71
-
72
-
73
-
74
-
75
-
76
-
77
-
78
-
79
-
80
-
81
-
82
-
83
-
84
-
85
-
86
-
87
-
88
-
89
-
90
-
91
-
92
-
93
-
94
-
95
-
96
-
97
-
98
-
99
-
100
-
101
-
102
-
103
-
104
-
105
-
106
-
107
-
108
-
109
-
110
-
111
-
112
-
113
-
114
-
115
-
116
-
117
-
118
-
119
-
120
-
121
-
122
-
123
-
124
-
125
-
126
-
127
-
128
-
129
-
130
-
131
-
132
-
133
-
134
-
135
-
136
 |
 |
UNITED PARCEL SERVICE, INC. AND SUBSIDIARIES
MANAGEMENT'S DISCUSSION AND ANALYSIS OF FINANCIAL CONDITION AND
RESULTS OF OPERATIONS
45
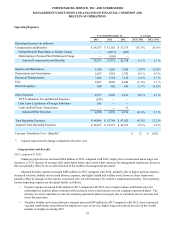
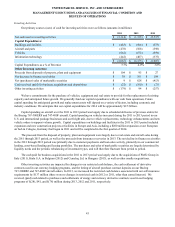
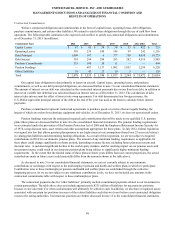
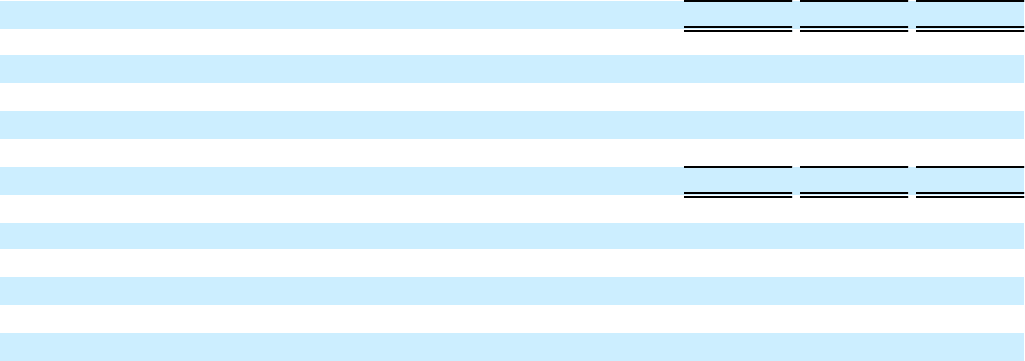
Investing Activities
Our primary sources (uses) of cash for investing activities were as follows (amounts in millions):
2013 2012 2011
Net cash used in investing activities $ (2,114) $ (1,335) $ (2,537)
Capital Expenditures:
Buildings and facilities $ (483) $ (506) $ (373)
Aircraft and parts (478)(568)(598)
Vehicles (662)(672)(659)
Information technology (442)(407)(375)
$(2,065) $ (2,153) $ (2,005)
Capital Expenditures as a % of Revenue 3.7% 4.0% 3.8%
Other Investing Activities:
Proceeds from disposals of property, plant and equipment $ 104 $ 95 $ 27
Net decrease in finance receivables $ 39 $ 101 $ 184
Net (purchases) sales of marketable securities $ 9 $ 628 $ (413)
Cash received (paid) for business acquisitions and dispositions $ (22) $ (100) $ (73)
Other investing activities $ (179) $ 94 $ (257)
We have commitments for the purchase of vehicles, equipment and real estate to provide for the replacement of existing
capacity and anticipated future growth. We generally fund our capital expenditures with our cash from operations. Future
capital spending for anticipated growth and replacement assets will depend on a variety of factors, including economic and
industry conditions. We anticipate that our capital expenditures for 2014 will be approximately $2.5 billion.
Capital spending on aircraft over the 2011 to 2013 period was largely due to scheduled deliveries of previous orders for
the Boeing 767-300ERF and 747-400F aircraft. Capital spending on vehicles increased during the 2011 to 2013 period in our
U.S. and international package businesses and our freight unit, due to vehicle replacements, technology enhancements and new
vehicle orders to support volume growth. Capital expenditures on buildings and facilities in the 2011 to 2013 period included
expansion and new construction projects at facilities in Europe and Asia, including a $200 million expansion at our European
air hub in Cologne, Germany that began in 2011 and will be completed in the first quarter of 2014.
The proceeds from the disposal of property, plant and equipment were largely due to real estate and aircraft sales during
the 2011 through 2013 period, as well as the proceeds from insurance recoveries in 2013. The net decline in finance receivables
in the 2011 through 2013 period was primarily due to customer paydowns and loan sales activity, primarily in our commercial
lending, asset-based lending and leasing portfolios. The purchases and sales of marketable securities are largely determined by
liquidity needs and the periodic rebalancing of investment types, and will therefore fluctuate from period to period.
The cash paid for business acquisitions in the 2011 to 2013 period was largely due to the acquisitions of Pieffe Group in
Italy (2011), Kiala S.A. in Belgium (2012) and Cemelog Ltd. in Hungary (2013), as well as other smaller acquisitions.
Other investing activities are impacted by changes in our restricted cash balance, the cash settlement of derivative
contracts used in our currency hedging programs, and the timing of aircraft purchase contract deposits on our Boeing
767-300ERF and 747-400F aircraft orders. In 2013, we increased the restricted cash balance associated with our self-insurance
requirements by $137 million (there were no changes in restricted cash in 2012 or 2011, other than earned interest). We
received (paid) cash related to purchases and settlements of energy and currency derivative contracts used in our hedging
programs of $(28), $41, and $(78) million during 2013, 2012 and 2011, respectively.