UPS 2013 Annual Report Download - page 45
Download and view the complete annual report
Please find page 45 of the 2013 UPS annual report below. You can navigate through the pages in the report by either clicking on the pages listed below, or by using the keyword search tool below to find specific information within the annual report.-
 1
1 -
2
-
3
-
4
-
5
-
6
-
7
-
8
-
9
-
10
-
11
-
12
-
13
-
14
-
15
-
16
-
17
-
18
-
19
-
20
-
21
-
22
-
23
-
24
-
25
-
26
-
27
-
28
-
29
-
30
-
31
-
32
-
33
-
34
-
 35
35 -
 36
36 -
 37
37 -
 38
38 -
 39
39 -
 40
40 -
 41
41 -
 42
42 -
 43
43 -
 44
44 -
 45
45 -
 46
46 -
 47
47 -
 48
48 -
 49
49 -
 50
50 -
 51
51 -
 52
52 -
 53
53 -
 54
54 -
 55
55 -
56
-
57
-
58
-
59
-
60
-
61
-
62
-
63
-
64
-
65
-
66
-
67
-
68
-
69
-
70
-
71
-
72
-
73
-
74
-
75
-
76
-
77
-
78
-
79
-
80
-
81
-
82
-
83
-
84
-
85
-
86
-
87
-
88
-
89
-
90
-
91
-
92
-
93
-
94
-
95
-
96
-
97
-
98
-
99
-
100
-
101
-
102
-
103
-
104
-
105
-
106
-
107
-
108
-
109
-
110
-
111
-
112
-
113
-
114
-
115
-
116
-
117
-
118
-
119
-
120
-
121
-
122
-
123
-
124
-
125
-
126
-
127
-
128
-
129
-
130
-
131
-
132
-
133
-
134
-
135
-
136
 |
 |
UNITED PARCEL SERVICE, INC. AND SUBSIDIARIES
MANAGEMENT'S DISCUSSION AND ANALYSIS OF FINANCIAL CONDITION AND
RESULTS OF OPERATIONS
33
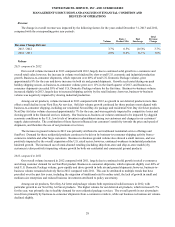
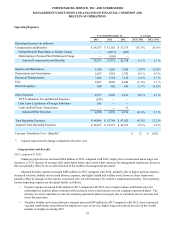
Volume
2013 compared to 2012
Our overall average daily volume increased in 2013 compared with 2012, largely due to growth in key markets in Europe,
as well as Canada and Mexico.
Export volume increased in 2013, and was driven by Europe (largely in the intra-European trade lanes) and the Americas
(particularly in the Canada-to-U.S. and Mexico-to-U.S. trade lanes). Asian export volume grew at a moderate pace due to
continued regional economic growth and expansion of our service offerings, but was negatively impacted by fewer technology
product launches from our customers and a small number of competitive losses. Volume continued to shift towards our
standard products, such as Transborder Standard and Worldwide Expedited, as compared with our premium express products,
such as Worldwide Express. Our international customers continued to be impacted by economic pressures and changes in their
supply chain networks, and the combination of these factors influenced their sensitivity towards the price and speed of
shipments.
Domestic volume increased in 2013 compared to 2012, and was driven by solid volume growth in several key markets,
including Italy, Canada, Poland and Turkey.
2012 compared to 2011
Our overall average daily volume increased slightly in 2012 compared with 2011, as the worldwide economic slowdown
and the associated impact on global trade restrained the growth of the international small package market.
Export volume increased in 2012 compared with 2011, as growth was achieved in several key trade lanes. Asia to U.S.
export volume increased, and was favorably impacted by new technology sector product launches from several customers.
Intra-regional export volume increased in Europe and Asia, as more regional sourcing by customers led to growth in our
Transborder products. U.S. export volume declined, particularly exports from the U.S. to Europe, as economic weakness within
the European Union negatively impacted volume. Additionally, overall export volume continued to shift towards our less
premium products, such as Transborder Standard and Worldwide Expedited, as compared with our premium express products,
such as Worldwide Express, primarily due to the impact of the weaker economic conditions on our customers internationally.
Domestic volume decreased during 2012 compared with 2011, and was negatively impacted by economic weakness
across Europe; however, this was partially offset by domestic volume growth in the U.K. and Canada.
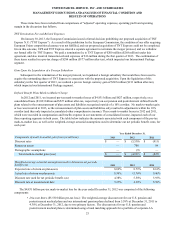
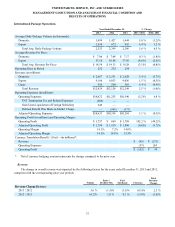
Rates and Product Mix
2013 compared to 2012
Total average revenue per piece decreased 2.5% in 2013 on a currency-adjusted basis, and was impacted by changes in
base rates, customer and product mix, and fuel surcharge rates.
On December 31, 2012, we increased the base rates 6.5% for international shipments originating in the United States
(Worldwide Express, Worldwide Express Plus, UPS Worldwide Expedited and UPS International Standard service), while
reducing fuel surcharge indices. Rate changes for shipments originating outside the U.S. are made throughout the year and vary
by geographic market.
Currency-adjusted export revenue per piece decreased 3.7% in 2013, as the shift in product mix from our premium
express products to our standard products more than offset the increase in base rates. Currency-adjusted export revenue per
piece was also negatively affected by the faster growth among our larger customers, which tend to have a lower yield than
middle market and smaller accounts. Additionally, currency-adjusted export revenue per piece was adversely impacted by
shorter average trade lanes (due to faster growth in intra-regional shipments), as well as a small impact on pricing from
overcapacity in the Asia outbound freight market.
Currency-adjusted domestic revenue per piece decreased 0.4% in 2013. Domestic revenue per piece was adversely
impacted by the faster domestic volume growth in our lower-yielding standard service, as well as product and customer mix
changes in several developed markets.