UPS 2013 Annual Report Download - page 91
Download and view the complete annual report
Please find page 91 of the 2013 UPS annual report below. You can navigate through the pages in the report by either clicking on the pages listed below, or by using the keyword search tool below to find specific information within the annual report.-
 1
1 -
2
-
3
-
4
-
5
-
6
-
7
-
8
-
9
-
10
-
11
-
12
-
13
-
14
-
15
-
16
-
17
-
18
-
19
-
20
-
21
-
22
-
23
-
24
-
25
-
26
-
27
-
28
-
29
-
30
-
31
-
32
-
33
-
34
-
35
-
36
-
37
-
38
-
39
-
40
-
41
-
42
-
43
-
44
-
45
-
46
-
47
-
48
-
49
-
50
-
51
-
52
-
53
-
54
-
55
-
56
-
57
-
58
-
59
-
60
-
61
-
62
-
63
-
64
-
65
-
66
-
67
-
68
-
69
-
70
-
71
-
72
-
73
-
74
-
75
-
76
-
77
-
78
-
79
-
80
-
 81
81 -
 82
82 -
 83
83 -
 84
84 -
 85
85 -
 86
86 -
 87
87 -
 88
88 -
 89
89 -
 90
90 -
 91
91 -
 92
92 -
 93
93 -
 94
94 -
 95
95 -
 96
96 -
 97
97 -
 98
98 -
 99
99 -
 100
100 -
 101
101 -
102
-
103
-
104
-
105
-
106
-
107
-
108
-
109
-
110
-
111
-
112
-
113
-
114
-
115
-
116
-
117
-
118
-
119
-
120
-
121
-
122
-
123
-
124
-
125
-
126
-
127
-
128
-
129
-
130
-
131
-
132
-
133
-
134
-
135
-
136
 |
 |

UNITED PARCEL SERVICE, INC. AND SUBSIDIARIES
NOTES TO CONSOLIDATED FINANCIAL STATEMENTS
79
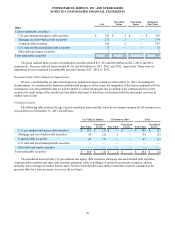
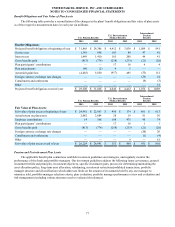
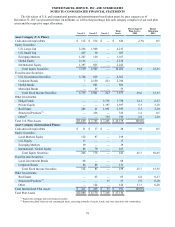
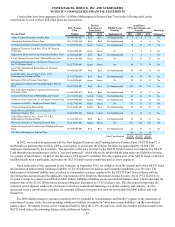
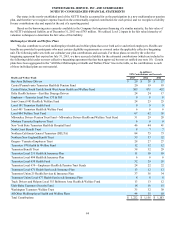
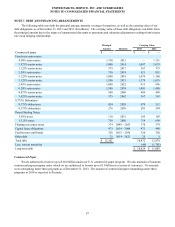
The fair values of U.S. and international pension and postretirement benefit plan assets by asset category as of
December 31, 2013 are presented below (in millions), as well as the percentage that each category comprises of our total plan
assets and the respective target allocations.
Level 1 Level 2 Level 3 Total
Assets
Percentage of
Plan Assets -
2013
Target
Allocation
2013
Asset Category (U.S. Plans):
Cash and cash equivalents $ 112 $ 514 $ — $ 626 2.3% 0-5
Equity Securities:
U.S. Large Cap 2,264 1,948 — 4,212
U.S. Small Cap 457 50 — 507
Emerging Markets 1,247 120 — 1,367
Global Equity 2,154 — — 2,154
International Equity 1,397 825 — 2,222
Total Equity Securities 7,519 2,943 — 10,462 39.4 25-55
Fixed Income Securities:
U.S. Government Securities 3,746 615 — 4,361
Corporate Bonds 7 2,550 223 2,780
Global Bonds — 681 — 681
Municipal Bonds — 55 — 55
Total Fixed Income Securities 3,753 3,901 223 7,877 29.6 15-35
Other Investments:
Hedge Funds — — 3,738 3,738 14.1 8-15
Private Equity — — 1,397 1,397 5.3 3-10
Real Estate 285 21 1,091 1,397 5.3 3-10
Structured Products(1) — 326 — 326 1.2 0-5
Other(2) — — 756 756 2.8 1-10
Total U.S. Plan Assets $11,669 $ 7,705 $ 7,205 $ 26,579 100.0%
Asset Category (International Plans):
Cash and cash equivalents $ 11 $ 17 $ — 28 3.0 0-5
Equity Securities:
Local Markets Equity 122 97 — 219
U.S. Equity 17 — — 17
Emerging Markets 19 — — 19
International / Global Equity 88 79 — 167
Total Equity Securities 246 176 — 422 45.3 50-65
Fixed Income Securities:
Local Government Bonds 68 — — 68
Corporate Bonds 86 85 — 171
Total Fixed Income Securities 154 85 — 239 25.7 15-35
Other Investments:
Real Estate — 63 — 63 6.8 0-17
Structured Products(1) — — 55 55 5.9 0-10
Other — 124 — 124 13.3 0-20
Total International Plan Assets $ 411 $ 465 $ 55 $ 931 100.0%
Total Plan Assets $12,080 $ 8,170 $ 7,260 $ 27,510
(1) Represents mortgage and asset-backed securities.
(2) Represents global balanced-risk commingled funds, consisting primarily of equity, bonds, and some currencies and commodities.