UPS 2010 Annual Report Download - page 96
Download and view the complete annual report
Please find page 96 of the 2010 UPS annual report below. You can navigate through the pages in the report by either clicking on the pages listed below, or by using the keyword search tool below to find specific information within the annual report.-
 1
1 -
2
-
3
-
4
-
5
-
6
-
7
-
8
-
9
-
10
-
11
-
12
-
13
-
14
-
15
-
16
-
17
-
18
-
19
-
20
-
21
-
22
-
23
-
24
-
25
-
26
-
27
-
28
-
29
-
30
-
31
-
32
-
33
-
34
-
35
-
36
-
37
-
38
-
39
-
40
-
41
-
42
-
43
-
44
-
45
-
46
-
47
-
48
-
49
-
50
-
51
-
52
-
53
-
54
-
55
-
56
-
57
-
58
-
59
-
60
-
61
-
62
-
63
-
64
-
65
-
66
-
67
-
68
-
69
-
70
-
71
-
72
-
73
-
74
-
75
-
76
-
77
-
78
-
79
-
80
-
81
-
82
-
83
-
84
-
85
-
 86
86 -
 87
87 -
 88
88 -
 89
89 -
 90
90 -
 91
91 -
 92
92 -
 93
93 -
 94
94 -
 95
95 -
 96
96 -
 97
97 -
 98
98 -
 99
99 -
 100
100 -
 101
101 -
 102
102 -
 103
103 -
 104
104 -
 105
105 -
 106
106 -
107
-
108
-
109
-
110
-
111
-
112
-
113
-
114
-
115
-
116
-
117
-
118
-
119
-
120
-
121
-
122
-
123
-
124
-
125
-
126
-
127
-
128
-
129
-
130
-
131
-
132
-
133
-
134
-
135
-
136
 |
 |

UNITED PARCEL SERVICE, INC. AND SUBSIDIARIES
NOTES TO CONSOLIDATED FINANCIAL STATEMENTS—(Continued)
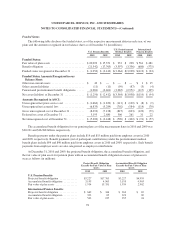
expectations. Additionally, the LTL sector in 2008 was adversely impacted by the economic recession in the
U.S., lower industrial production and retail sales, volatile fuel prices, and significant levels of price-based
competition. By the fourth quarter of 2008, the combination of these internal and external factors reduced our
near term expectations for this unit, leading to the goodwill impairment charge.
None of the other reporting units incurred an impairment of goodwill in 2008, nor did we have any goodwill
impairment charges in 2010 or 2009. Cumulatively, our Supply Chain & Freight reporting segment has recorded
goodwill impairment charges of $622 million, while our International and U.S. Domestic Package segments have
not recorded any impairment charges.
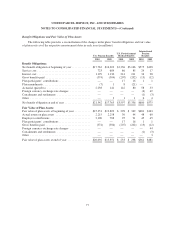
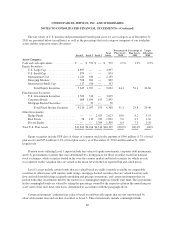
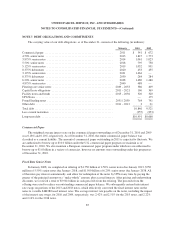
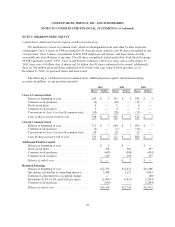
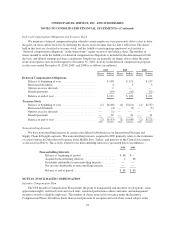
Intangible Assets
The following is a summary of intangible assets at December 31, 2010 and 2009 (in millions):
Gross Carrying
Amount
Accumulated
Amortization
Net Carrying
Value
Weighted-
Average
Amortization
Period
(in years)
December 31, 2010:
Trademarks, licenses, patents, and other ........ $ 187 $ (50) $137 4.8
Customer lists ............................ 99 (59) 40 9.1
Franchise rights ........................... 109 (52) 57 20.0
Capitalized software ....................... 1,927 (1,562) 365 3.1
Total Intangible Assets, Net ................. $2,322 $(1,723) $599 4.3
December 31, 2009:
Trademarks, licenses, patents, and other ........ $ 132 $ (9) $123
Customer lists ............................ 107 (52) 55
Franchise rights ........................... 109 (46) 63
Capitalized software ....................... 1,812 (1,457) 355
Total Intangible Assets, Net ................. $2,160 $(1,564) $596
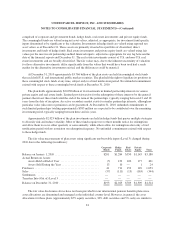
All of our recorded intangible assets other than goodwill are deemed to be finite-lived intangibles, and are
thus amortized over their estimated useful lives. Impairment tests for these intangible assets are only performed
when a triggering event occurs that indicates that the carrying value of the intangible may not be recoverable. In
2008, as a result of weak performance in our domestic package operations in the United Kingdom, we reviewed
our long-lived assets, including intangible assets, for impairment within our U.K. domestic package entity. Based
on prior performance and near-term projections, the value assigned to the customer list intangible asset acquired
within the U.K. domestic package business was determined to be impaired. This impairment was the result of
both higher than anticipated customer turnover and reduced operating margins associated with the acquired
business. Accordingly, an intangible asset impairment charge of $27 million was recorded for the year ended
December 31, 2008, which is included in the caption “other expenses” in the consolidated income statement.
There were no impairments of intangible assets in 2009 or 2010.
Amortization of intangible assets was $224, $185 and $202 million during 2010, 2009 and 2008,
respectively. Expected amortization of finite-lived intangible assets recorded as of December 31, 2010 for the
next five years is as follows (in millions): 2011—$238; 2012—$177; 2013—$106; 2014—$35; 2015—$12.
Amortization expense in future periods will be affected by business acquisitions, software development,
licensing agreements, sponsorships and other factors.
84