UPS 2010 Annual Report Download - page 112
Download and view the complete annual report
Please find page 112 of the 2010 UPS annual report below. You can navigate through the pages in the report by either clicking on the pages listed below, or by using the keyword search tool below to find specific information within the annual report.-
 1
1 -
2
-
3
-
4
-
5
-
6
-
7
-
8
-
9
-
10
-
11
-
12
-
13
-
14
-
15
-
16
-
17
-
18
-
19
-
20
-
21
-
22
-
23
-
24
-
25
-
26
-
27
-
28
-
29
-
30
-
31
-
32
-
33
-
34
-
35
-
36
-
37
-
38
-
39
-
40
-
41
-
42
-
43
-
44
-
45
-
46
-
47
-
48
-
49
-
50
-
51
-
52
-
53
-
54
-
55
-
56
-
57
-
58
-
59
-
60
-
61
-
62
-
63
-
64
-
65
-
66
-
67
-
68
-
69
-
70
-
71
-
72
-
73
-
74
-
75
-
76
-
77
-
78
-
79
-
80
-
81
-
82
-
83
-
84
-
85
-
86
-
87
-
88
-
89
-
90
-
91
-
92
-
93
-
94
-
95
-
96
-
97
-
98
-
99
-
100
-
101
-
 102
102 -
 103
103 -
 104
104 -
 105
105 -
 106
106 -
 107
107 -
 108
108 -
 109
109 -
 110
110 -
 111
111 -
 112
112 -
 113
113 -
 114
114 -
 115
115 -
 116
116 -
 117
117 -
 118
118 -
 119
119 -
 120
120 -
 121
121 -
 122
122 -
123
-
124
-
125
-
126
-
127
-
128
-
129
-
130
-
131
-
132
-
133
-
134
-
135
-
136
 |
 |

UNITED PARCEL SERVICE, INC. AND SUBSIDIARIES
NOTES TO CONSOLIDATED FINANCIAL STATEMENTS—(Continued)
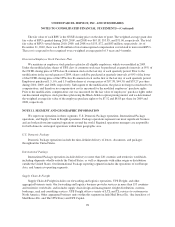
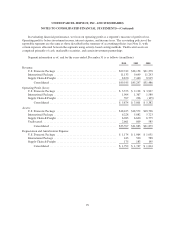
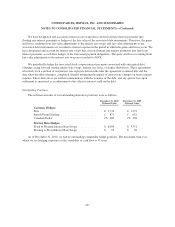
Revenue by product type for the years ended December 31 is as follows (in millions):
2010 2009 2008
U.S. Domestic Package:
Next Day Air .................................................. $ 5,835 $ 5,456 $ 6,559
Deferred ...................................................... 2,975 2,859 3,325
Ground ....................................................... 20,932 19,843 21,394
Total U.S. Domestic Package .................................. 29,742 28,158 31,278
International Package:
Domestic ...................................................... 2,365 2,111 2,344
Export ........................................................ 8,234 7,176 8,294
Cargo ........................................................ 534 412 655
Total International Package ................................... 11,133 9,699 11,293
Supply Chain & Freight:
Forwarding and Logistics ......................................... 6,022 5,080 6,293
Freight ....................................................... 2,208 1,943 2,191
Other ......................................................... 440 417 431
Total Supply Chain & Freight ................................. 8,670 7,440 8,915
Consolidated ................................................... $49,545 $45,297 $51,486
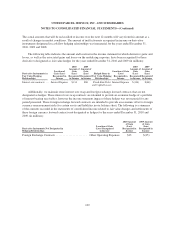
Geographic information as of, and for the years ended, December 31 is as follows (in millions):
2010 2009 2008
United States:
Revenue ...................................................... $36,795 $34,375 $38,553
Long-lived assets ............................................... $16,693 $17,336 $17,422
International:
Revenue ...................................................... $12,750 $10,922 $12,933
Long-lived assets ............................................... $ 5,047 $ 4,935 $ 5,136
Consolidated:
Revenue ...................................................... $49,545 $45,297 $51,486
Long-lived assets ............................................... $21,740 $22,271 $22,558
Long-lived assets include property, plant and equipment, pension and postretirement benefit assets, long-
term investments, goodwill, and intangible assets.
No countries outside of the United States, nor any individual customers, provided 10% or more of
consolidated revenue in 2010, 2009 or 2008.
100