UPS 2010 Annual Report Download - page 46
Download and view the complete annual report
Please find page 46 of the 2010 UPS annual report below. You can navigate through the pages in the report by either clicking on the pages listed below, or by using the keyword search tool below to find specific information within the annual report.-
 1
1 -
2
-
3
-
4
-
5
-
6
-
7
-
8
-
9
-
10
-
11
-
12
-
13
-
14
-
15
-
16
-
17
-
18
-
19
-
20
-
21
-
22
-
23
-
24
-
25
-
26
-
27
-
28
-
29
-
30
-
31
-
32
-
33
-
34
-
35
-
 36
36 -
 37
37 -
 38
38 -
 39
39 -
 40
40 -
 41
41 -
 42
42 -
 43
43 -
 44
44 -
 45
45 -
 46
46 -
 47
47 -
 48
48 -
 49
49 -
 50
50 -
 51
51 -
 52
52 -
 53
53 -
 54
54 -
 55
55 -
 56
56 -
57
-
58
-
59
-
60
-
61
-
62
-
63
-
64
-
65
-
66
-
67
-
68
-
69
-
70
-
71
-
72
-
73
-
74
-
75
-
76
-
77
-
78
-
79
-
80
-
81
-
82
-
83
-
84
-
85
-
86
-
87
-
88
-
89
-
90
-
91
-
92
-
93
-
94
-
95
-
96
-
97
-
98
-
99
-
100
-
101
-
102
-
103
-
104
-
105
-
106
-
107
-
108
-
109
-
110
-
111
-
112
-
113
-
114
-
115
-
116
-
117
-
118
-
119
-
120
-
121
-
122
-
123
-
124
-
125
-
126
-
127
-
128
-
129
-
130
-
131
-
132
-
133
-
134
-
135
-
136
 |
 |

Other Occupancy
The decrease in other occupancy expense in 2010 was primarily due to decreased labor and overhead
expenses, and lower rent expense on leased facilities. The decrease in other occupancy expense in 2009 was
primarily caused by lower electricity and natural gas costs, as well as lower rent expense.
Other Expenses
The decrease in other expenses in 2010 was largely due to reductions in bad debt expense and foreign
currency transaction expense, which reflected gains during 2010 compared to losses in 2009. Additionally, we
incurred a loss on the sale of a French repair business in 2009. Additional expense reductions in 2010 were due to
cost containment programs, including reductions in telecom costs, office supplies, and outside professional fees.
We also incurred lower expenses associated with auto liability insurance and customer claims for lost or
damaged packages.
The decline in other expenses in 2009, exclusive of impairment charges, was due in part to certain variable
costs that declined as a result of lower package volume, such as the expense associated with customer claims for
lost or damaged packages, rent expense for transportation equipment, cargo handling costs, and aircraft landing
fees. Additionally, certain other costs declined primarily as a result of cost containment programs, such as
employee expense reimbursements, office supplies, professional services, and advertising costs.
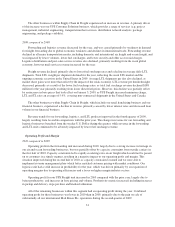
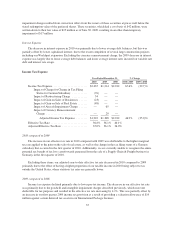
Investment Income and Interest Expense
Year Ended December 31, % Change
2010 2009 2008 2010 / 2009 2009 / 2008
Investment Income and Interest Expense (in millions):
Investment Income .................................... $ 3 $ 10 $ 75 (70.0)% (86.7)%
Interest Expense ...................................... $(354) $(445) $(442) (20.4)% 0.7%
Impact of Currency Remeasurement Charge ............ — 77 —
Adjusted Interest Expense ...................... $(354) $(368) $(442) (3.8)% (16.7)%
Investment Income
The decrease in investment income in 2010 was primarily due to a lower yield earned on our invested assets
as a result of declines in short-term interest rates in the United States, as well as higher impairment losses on our
holdings of auction rate and preferred securities. The 2009 decline was largely due to a lower average balance of
interest-earning investments, a significantly lower yield earned on our invested assets as a result of declines in
short-term interest rates in the United States, and a loss on the fair value adjustments of certain investment
partnerships.
During the second quarter of 2010, we recorded impairment losses on certain asset-backed auction rate
securities. The impairment charge resulted from provisions that allow the issuers of the securities to subordinate
our holdings to newly issued debt or to tender for the securities at less than their par value. These securities,
which had a cost basis of $128 million, were written down to their fair value of $107 million as of June 30, 2010,
resulting in an other-than-temporary impairment of $21 million.
During the second quarter of 2009, we recorded impairment losses on certain perpetual preferred securities,
and an auction rate security collateralized by preferred securities, issued by large financial institutions. The
34