UPS 2010 Annual Report Download - page 68
Download and view the complete annual report
Please find page 68 of the 2010 UPS annual report below. You can navigate through the pages in the report by either clicking on the pages listed below, or by using the keyword search tool below to find specific information within the annual report.-
 1
1 -
2
-
3
-
4
-
5
-
6
-
7
-
8
-
9
-
10
-
11
-
12
-
13
-
14
-
15
-
16
-
17
-
18
-
19
-
20
-
21
-
22
-
23
-
24
-
25
-
26
-
27
-
28
-
29
-
30
-
31
-
32
-
33
-
34
-
35
-
36
-
37
-
38
-
39
-
40
-
41
-
42
-
43
-
44
-
45
-
46
-
47
-
48
-
49
-
50
-
51
-
52
-
53
-
54
-
55
-
56
-
57
-
 58
58 -
 59
59 -
 60
60 -
 61
61 -
 62
62 -
 63
63 -
 64
64 -
 65
65 -
 66
66 -
 67
67 -
 68
68 -
 69
69 -
 70
70 -
 71
71 -
 72
72 -
 73
73 -
 74
74 -
 75
75 -
 76
76 -
 77
77 -
 78
78 -
79
-
80
-
81
-
82
-
83
-
84
-
85
-
86
-
87
-
88
-
89
-
90
-
91
-
92
-
93
-
94
-
95
-
96
-
97
-
98
-
99
-
100
-
101
-
102
-
103
-
104
-
105
-
106
-
107
-
108
-
109
-
110
-
111
-
112
-
113
-
114
-
115
-
116
-
117
-
118
-
119
-
120
-
121
-
122
-
123
-
124
-
125
-
126
-
127
-
128
-
129
-
130
-
131
-
132
-
133
-
134
-
135
-
136
 |
 |

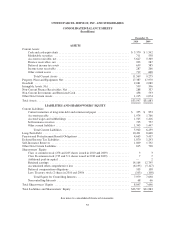
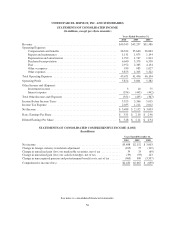
UNITED PARCEL SERVICE, INC. AND SUBSIDIARIES
STATEMENTS OF CONSOLIDATED INCOME
(In millions, except per share amounts)
Years Ended December 31,
2010 2009 2008
Revenue .......................................................... $49,545 $45,297 $51,486
Operating Expenses:
Compensation and benefits ....................................... 26,324 25,640 26,063
Repairs and maintenance ......................................... 1,131 1,075 1,194
Depreciation and amortization ..................................... 1,792 1,747 1,814
Purchased transportation ......................................... 6,640 5,379 6,550
Fuel .......................................................... 2,972 2,365 4,134
Other occupancy ................................................ 939 985 1,027
Other expenses ................................................. 3,873 4,305 5,322
Total Operating Expenses ............................................ 43,671 41,496 46,104
Operating Profit .................................................... 5,874 3,801 5,382
Other Income and (Expense):
Investment income .............................................. 3 10 75
Interest expense ................................................ (354) (445) (442)
Total Other Income and (Expense) ..................................... (351) (435) (367)
Income Before Income Taxes ......................................... 5,523 3,366 5,015
Income Tax Expense ................................................ 2,035 1,214 2,012
Net Income ........................................................ $ 3,488 $ 2,152 $ 3,003
Basic Earnings Per Share ............................................. $ 3.51 $ 2.16 $ 2.96
Diluted Earnings Per Share ........................................... $ 3.48 $ 2.14 $ 2.94
STATEMENTS OF CONSOLIDATED COMPREHENSIVE INCOME (LOSS)
(In millions)
Years Ended December 31,
2010 2009 2008
Net income .......................................................... $3,488 $2,152 $ 3,003
Change in foreign currency translation adjustment ........................... (105) 75 (119)
Change in unrealized gain (loss) on marketable securities, net of tax ............. 39 33 (69)
Change in unrealized gain (loss) on cash flow hedges, net of tax ................ (39) (93) 143
Change in unrecognized pension and postretirement benefit costs, net of tax ....... (963) 500 (3,597)
Comprehensive income (loss) ............................................ $2,420 $2,667 $ (639)
See notes to consolidated financial statements.
56