UPS 2010 Annual Report Download - page 39
Download and view the complete annual report
Please find page 39 of the 2010 UPS annual report below. You can navigate through the pages in the report by either clicking on the pages listed below, or by using the keyword search tool below to find specific information within the annual report.-
 1
1 -
2
-
3
-
4
-
5
-
6
-
7
-
8
-
9
-
10
-
11
-
12
-
13
-
14
-
15
-
16
-
17
-
18
-
19
-
20
-
21
-
22
-
23
-
24
-
25
-
26
-
27
-
28
-
 29
29 -
 30
30 -
 31
31 -
 32
32 -
 33
33 -
 34
34 -
 35
35 -
 36
36 -
 37
37 -
 38
38 -
 39
39 -
 40
40 -
 41
41 -
 42
42 -
 43
43 -
 44
44 -
 45
45 -
 46
46 -
 47
47 -
 48
48 -
 49
49 -
50
-
51
-
52
-
53
-
54
-
55
-
56
-
57
-
58
-
59
-
60
-
61
-
62
-
63
-
64
-
65
-
66
-
67
-
68
-
69
-
70
-
71
-
72
-
73
-
74
-
75
-
76
-
77
-
78
-
79
-
80
-
81
-
82
-
83
-
84
-
85
-
86
-
87
-
88
-
89
-
90
-
91
-
92
-
93
-
94
-
95
-
96
-
97
-
98
-
99
-
100
-
101
-
102
-
103
-
104
-
105
-
106
-
107
-
108
-
109
-
110
-
111
-
112
-
113
-
114
-
115
-
116
-
117
-
118
-
119
-
120
-
121
-
122
-
123
-
124
-
125
-
126
-
127
-
128
-
129
-
130
-
131
-
132
-
133
-
134
-
135
-
136
 |
 |

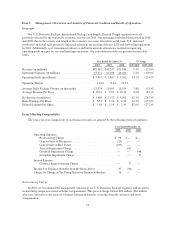
well as the increase in volume for our air and ground products. In 2009, fuel surcharge revenue decreased by
$1.924 billion due to lower fuel surcharge rates and the decline in volume for our air and ground products.
Operating Profit and Margin
2010 compared to 2009
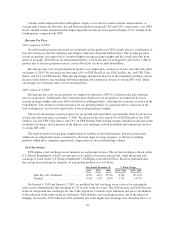
Operating profit in 2010 was positively impacted by the overall economic growth in the U.S., which drove
increased volume and yields. Combined with increased network efficiencies and cost containment initiatives, this
resulted in strong operating leverage. Network efficiencies were achieved in 2010, as we adjusted our air and
ground networks to better match volume levels, and utilized our expanded Worldport facility to utilize larger
aircraft as well as increase package sorting efficiency. These changes have resulted in cost savings through fewer
aircraft block hours, labor hours in our operations, and vehicle miles driven. Improved pick-up and delivery
densities have also increased productivity in our operations. In addition to these factors, management salary costs
declined as a result of a decrease in the total number of management employees through attrition combined with
voluntary and involuntary workforce reductions. The combination of these factors led to an increase in the
operating margin in 2010 compared with 2009.
2009 compared to 2008
Operating profit in 2009 was adversely impacted by the U.S. economic recession, decreased network
efficiencies due to the decline in volume, changes in package characteristics, and a shift in product mix away
from our premium services. Operating profit was also negatively impacted as we incurred a larger decline in fuel
surcharge revenue compared with the decline in fuel expense. We adjusted our air and ground networks to better
match these lower volume levels, as well as reduced labor hours and employee headcount, resulting in cost
savings. Operating profit trends improved during the fourth quarter of 2009 due to both improving volume trends
and the positive impact of continued cost and production efficiencies, which combined to improve the operating
margin to 10.1% for the quarter.
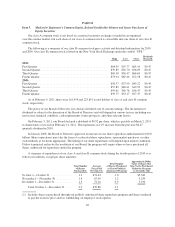
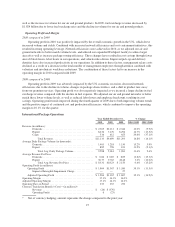
International Package Operations
Year Ended December 31, % Change
2010 2009 2008 2010 / 2009 2009 / 2008
Revenue (in millions):
Domestic ....................................... $ 2,365 $2,111 $ 2,344 12.0% (9.9)%
Export ......................................... 8,234 7,176 8,294 14.7% (13.5)%
Cargo ......................................... 534 412 655 29.6% (37.1)%
Total Revenue ............................... $11,133 $9,699 $11,293 14.8% (14.1)%
Average Daily Package Volume (in thousands):
Domestic ....................................... 1,403 1,218 1,150 15.2% 5.9%
Export ......................................... 885 796 813 11.2% (2.1)%
Total Avg. Daily Package Volume ............... 2,288 2,014 1,963 13.6% 2.6%
Average Revenue Per Piece:
Domestic ....................................... $ 6.66 $ 6.85 $ 8.09 (2.8)% (15.3)%
Export ......................................... 36.77 35.63 40.48 3.2% (12.0)%
Total Avg. Revenue Per Piece .................. $ 18.31 $18.23 $ 21.50 0.4% (15.2)%
Operating Profit (in millions):
Operating Profit ..................................... $ 1,904 $1,367 $ 1,580 39.3% (13.5)%
Impact of Intangible Impairment Charge .............. — — 27
Adjusted Operating Profit ............................. $ 1,904 $1,367 $ 1,607 39.3% (14.9)%
Operating Margin ........................................ 17.1% 14.1% 14.0%
Adjusted Operating Margin ................................ 17.1% 14.1% 14.2%
Operating Days in Period .................................. 253 253 252
Currency Translation Benefit / (Cost)—(in millions)*:
Revenue ....................................... $ (24) $ (376)
Operating Profit ................................. 6 (23)
* Net of currency hedging; amount represents the change compared to the prior year.
27