UPS 2010 Annual Report Download - page 42
Download and view the complete annual report
Please find page 42 of the 2010 UPS annual report below. You can navigate through the pages in the report by either clicking on the pages listed below, or by using the keyword search tool below to find specific information within the annual report.-
 1
1 -
2
-
3
-
4
-
5
-
6
-
7
-
8
-
9
-
10
-
11
-
12
-
13
-
14
-
15
-
16
-
17
-
18
-
19
-
20
-
21
-
22
-
23
-
24
-
25
-
26
-
27
-
28
-
29
-
30
-
31
-
 32
32 -
 33
33 -
 34
34 -
 35
35 -
 36
36 -
 37
37 -
 38
38 -
 39
39 -
 40
40 -
 41
41 -
 42
42 -
 43
43 -
 44
44 -
 45
45 -
 46
46 -
 47
47 -
 48
48 -
 49
49 -
 50
50 -
 51
51 -
 52
52 -
53
-
54
-
55
-
56
-
57
-
58
-
59
-
60
-
61
-
62
-
63
-
64
-
65
-
66
-
67
-
68
-
69
-
70
-
71
-
72
-
73
-
74
-
75
-
76
-
77
-
78
-
79
-
80
-
81
-
82
-
83
-
84
-
85
-
86
-
87
-
88
-
89
-
90
-
91
-
92
-
93
-
94
-
95
-
96
-
97
-
98
-
99
-
100
-
101
-
102
-
103
-
104
-
105
-
106
-
107
-
108
-
109
-
110
-
111
-
112
-
113
-
114
-
115
-
116
-
117
-
118
-
119
-
120
-
121
-
122
-
123
-
124
-
125
-
126
-
127
-
128
-
129
-
130
-
131
-
132
-
133
-
134
-
135
-
136
 |
 |

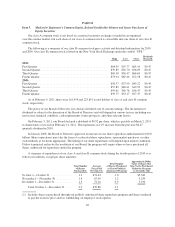
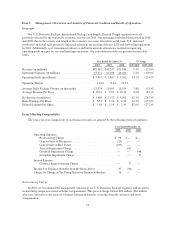
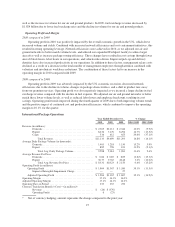
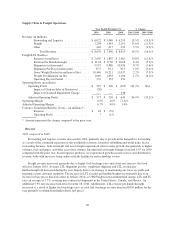
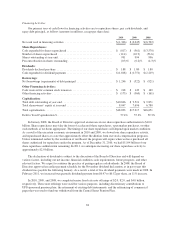
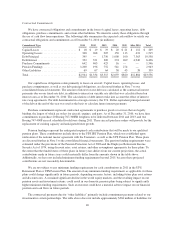
Supply Chain & Freight Operations
Year Ended December 31, % Change
2010 2009 2008 2010 / 2009 2009 / 2008
Revenue (in millions):
Forwarding and Logistics ................. $ 6,022 $ 5,080 $ 6,293 18.5% (19.3)%
Freight ................................ 2,208 1,943 2,191 13.6% (11.3)%
Other ................................. 440 417 431 5.5% (3.2)%
Total Revenue ...................... $ 8,670 $ 7,440 $ 8,915 16.5% (16.5)%
Freight LTL Statistics:
Revenue (in millions) .................... $ 2,002 $ 1,807 $ 2,062 10.8% (12.4)%
Revenue Per Hundredweight ............... $ 19.18 $ 17.69 $ 18.68 8.4% (5.3)%
Shipments (in thousands) .................. 9,952 9,880 10,036 0.7% (1.6)%
Shipments Per Day (in thousands) ........... 39.5 39.1 39.5 1.0% (1.0)%
Gross Weight Hauled (in millions of lbs) ..... 10,440 10,211 11,037 2.2% (7.5)%
Weight Per Shipment (in lbs) .............. 1,049 1,033 1,100 1.5% (6.1)%
Operating Days in Period .................. 252 253 254
Operating Profit (in millions):
Operating Profit ............................. $ 597 $ 296 $ (105) 101.7% N/A
Impact of Gain on Sales of Businesses ....... (20) — —
Impact of Goodwill Impairment Charge ...... — — 548
Adjusted Operating Profit ..................... $ 577 $ 296 $ 443 94.9% (33.2)%
Operating Margin ................................ 6.9% 4.0% (1.2)%
Adjusted Operating Margin ........................ 6.7% 4.0% 5.0%
Currency Translation Benefit / (Cost)—(in millions)*:
Revenue ............................... $ 48 $ (52)
Operating Profit ......................... 7 (15)
* Amount represents the change compared to the prior year.
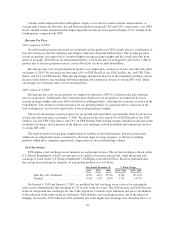
Revenue
2010 compared to 2009
Forwarding and logistics revenue increased in 2010, primarily due to growth in the demand for forwarding
as a result of the continued expansion of the worldwide economy, inventory rebuilding and world trade. In our
forwarding business, both air freight and ocean freight experienced solid revenue growth, due primarily to higher
volumes, fuel surcharges, and other accessorial charges. International air freight tonnage increased 19% for 2010
compared with the prior year. In our logistics products, we experienced growth in mail services and distribution
revenue, with solid increases being achieved in the healthcare and technology sectors.
Freight revenue increased, primarily due to higher fuel surcharge rates and a base rate increase that took
effect in January 2010. Average LTL shipments per day, weight per shipment and LTL revenue per
hundredweight all increased during the year, largely due to our strategy of maintaining our focus on yields and
targeting certain customer segments. The increase in LTL revenue per hundredweight was primarily due to an
increase in base prices that took effect in January 2010, as UPS Freight increased minimum charge, LTL and TL
rates an average of 5.7%, covering non-contractual shipments in the United States, Canada, and Mexico. An
additional 5.9% rate increase took effect October 18, 2010. Additionally, LTL revenue per hundredweight
increased as a result of higher fuel surcharge rates, as total fuel surcharge revenue increased $105 million for the
year primarily resulting from higher diesel fuel prices.
30