UPS 2010 Annual Report Download - page 41
Download and view the complete annual report
Please find page 41 of the 2010 UPS annual report below. You can navigate through the pages in the report by either clicking on the pages listed below, or by using the keyword search tool below to find specific information within the annual report.-
 1
1 -
2
-
3
-
4
-
5
-
6
-
7
-
8
-
9
-
10
-
11
-
12
-
13
-
14
-
15
-
16
-
17
-
18
-
19
-
20
-
21
-
22
-
23
-
24
-
25
-
26
-
27
-
28
-
29
-
30
-
 31
31 -
 32
32 -
 33
33 -
 34
34 -
 35
35 -
 36
36 -
 37
37 -
 38
38 -
 39
39 -
 40
40 -
 41
41 -
 42
42 -
 43
43 -
 44
44 -
 45
45 -
 46
46 -
 47
47 -
 48
48 -
 49
49 -
 50
50 -
 51
51 -
52
-
53
-
54
-
55
-
56
-
57
-
58
-
59
-
60
-
61
-
62
-
63
-
64
-
65
-
66
-
67
-
68
-
69
-
70
-
71
-
72
-
73
-
74
-
75
-
76
-
77
-
78
-
79
-
80
-
81
-
82
-
83
-
84
-
85
-
86
-
87
-
88
-
89
-
90
-
91
-
92
-
93
-
94
-
95
-
96
-
97
-
98
-
99
-
100
-
101
-
102
-
103
-
104
-
105
-
106
-
107
-
108
-
109
-
110
-
111
-
112
-
113
-
114
-
115
-
116
-
117
-
118
-
119
-
120
-
121
-
122
-
123
-
124
-
125
-
126
-
127
-
128
-
129
-
130
-
131
-
132
-
133
-
134
-
135
-
136
 |
 |
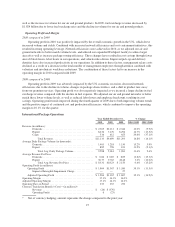
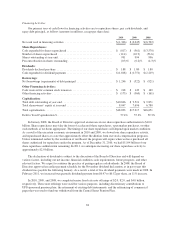
quarter of 2009. Currency-adjusted export revenue per piece declined 10.1% for 2009. Export revenue per piece
was impacted by the lower revenue per piece transborder products comprising a relatively larger portion of our
total volume, as we experienced larger volume declines on some of our longer export trade lanes with higher
yields. Domestic revenue per piece decreased, which was primarily caused by adverse currency exchange rate
fluctuations (currency-adjusted domestic revenue per piece declined 7.2% for the year), as well as the impact of
lower fuel surcharge rates. Total average revenue per piece decreased 12.1% for the year on a currency-adjusted
basis.
On January 5, 2009, we increased the base rates 6.9% for international shipments originating in the United
States (Worldwide Express, Worldwide Express Plus, UPS Worldwide Expedited and UPS International
Standard service). Rate changes for shipments originating outside the U.S. were made throughout the year and
varied by geographic market.
Export revenue per piece showed a significant improvement in the fourth quarter, as higher-yielding trade
lanes, such as Asia to Europe and Asia to North America, comprised a larger proportion of our total export
volume. Revenue per piece in the fourth quarter benefited from a weaker U.S. Dollar, but continued to be
adversely impacted by lower fuel surcharge rates.
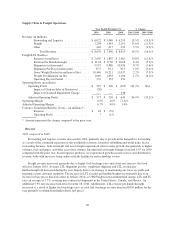
Fuel Surcharges
On January 4, 2010 and January 5, 2009, we modified the fuel surcharge on certain U.S.-related
international air services by reducing the index used to determine the fuel surcharge by 2% in each of the two
years. The fuel surcharges for products originating outside the United States continue to be indexed to fuel prices
in our different international regions, depending upon where the shipment takes place. Total international fuel
surcharge revenue increased by $299 million in 2010, due to higher fuel surcharge rates caused by increased fuel
prices as well as an increase in international air volume. Fuel surcharge revenue decreased by $788 million in
2009, due to lower fuel surcharge rates caused by decreased fuel prices, but this was partially offset by an
increase in international air volume.
Operating Profit and Margin
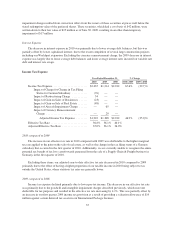
2010 compared to 2009
The increase in operating profit for 2010 was primarily driven by volume increases in all major regions and
trade lanes worldwide. The shift in product mix to our higher-margin premium services also contributed to the
increase in operating profits. Additionally, network efficiencies and cost containment initiatives created operating
leverage throughout our operations. These factors led to an increase in the operating margin in 2010 compared
with 2009.
2009 compared to 2008
The decline in operating profit for the year was caused primarily by a shift in product mix away from our
premium services, and volume declines in some of the longer export trade lanes. Operating profit was also
negatively impacted as we incurred a larger decline in fuel surcharge revenue compared with the decline in fuel
expense. To reduce costs, we adjusted our air network and reduced block hours and flight segments in certain
international regions. The volume trends began to improve later in the year, and in the fourth quarter operating
profit increased 19% (excluding an impairment charge in 2008), as the impact of cost initiatives and network
improvements drove an improvement in the operating margin to 16.7%.
29