UPS 2010 Annual Report Download - page 123
Download and view the complete annual report
Please find page 123 of the 2010 UPS annual report below. You can navigate through the pages in the report by either clicking on the pages listed below, or by using the keyword search tool below to find specific information within the annual report.-
 1
1 -
2
-
3
-
4
-
5
-
6
-
7
-
8
-
9
-
10
-
11
-
12
-
13
-
14
-
15
-
16
-
17
-
18
-
19
-
20
-
21
-
22
-
23
-
24
-
25
-
26
-
27
-
28
-
29
-
30
-
31
-
32
-
33
-
34
-
35
-
36
-
37
-
38
-
39
-
40
-
41
-
42
-
43
-
44
-
45
-
46
-
47
-
48
-
49
-
50
-
51
-
52
-
53
-
54
-
55
-
56
-
57
-
58
-
59
-
60
-
61
-
62
-
63
-
64
-
65
-
66
-
67
-
68
-
69
-
70
-
71
-
72
-
73
-
74
-
75
-
76
-
77
-
78
-
79
-
80
-
81
-
82
-
83
-
84
-
85
-
86
-
87
-
88
-
89
-
90
-
91
-
92
-
93
-
94
-
95
-
96
-
97
-
98
-
99
-
100
-
101
-
102
-
103
-
104
-
105
-
106
-
107
-
108
-
109
-
110
-
111
-
112
-
 113
113 -
 114
114 -
 115
115 -
 116
116 -
 117
117 -
 118
118 -
 119
119 -
 120
120 -
 121
121 -
 122
122 -
 123
123 -
 124
124 -
 125
125 -
 126
126 -
 127
127 -
 128
128 -
 129
129 -
 130
130 -
 131
131 -
 132
132 -
 133
133 -
134
-
135
-
136
 |
 |

UNITED PARCEL SERVICE, INC. AND SUBSIDIARIES
NOTES TO CONSOLIDATED FINANCIAL STATEMENTS—(Continued)
associated with employee severance payments, other employee benefits, transition services, and leases on
operating facilities and equipment. Additionally, we have provided a guarantee for a period of two years for
certain employee benefit payments being assumed by the buyer. We recorded a pre-tax loss of $51 million ($47
million after-tax) for this transaction in 2010, which included the costs associated with the sale transaction and
the fair value of the guarantee. This loss is recorded in the caption “other expenses” in the statements of
consolidated income.
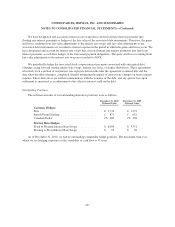
Supply Chain & Freight—United States
In December 2010, we completed the sale of our UPS Logistics Technologies, Inc. business unit, which
produced transportation routing and fleet management systems. We recognized a $71 million pre-tax gain on the
sale ($44 million after tax), which is included in the caption “other expenses” in the consolidated income
statement, and is included in the results of our Supply Chain & Freight segment. The operating results of the UPS
Logistics Technologies, Inc business unit were not material to our consolidated or segment operating results in
any of the periods presented.
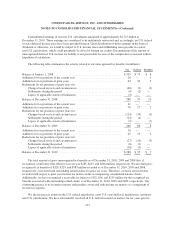
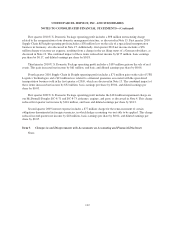
U.S. Domestic Package Restructuring
In an effort to improve performance in the U.S. Domestic Package segment, we announced a program to
streamline our domestic management structure in January 2010. As part of this restructuring, we reduced the
number of domestic districts and regions in our U.S. small package operation in order to better align our
operations geographically and allow more local decision-making and resources to be deployed for our customers.
Effective in April 2010, we reduced our U.S. regions from five to three and our U.S. districts from 46 to 20. The
restructuring eliminated approximately 1,800 management and administrative positions in the U.S.
Approximately 1,100 employees were offered voluntary severance packages, while other impacted employees
received severance benefits based on length of service, and access to support programs. We recorded a pre-tax
charge of $98 million ($64 million after-tax) in the first quarter of 2010 related to the costs of this program,
which reflects the value of voluntary retirement benefits, severance benefits and unvested stock compensation. In
2010, we incurred additional costs related to the relocation of employees and other restructuring activities,
however those costs were offset by savings from the staffing reductions.
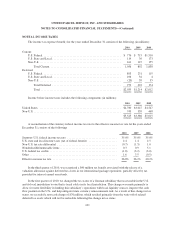
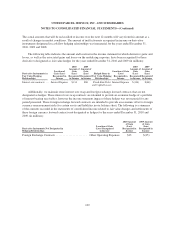
NOTE 16. QUARTERLY INFORMATION (unaudited)
First Quarter Second Quarter Third Quarter Fourth Quarter
2010 2009 2010 2009 2010 2009 2010 2009
Revenue:
U.S. Domestic Package ........ $ 7,102 $ 6,949 $ 7,269 $ 6,789 $ 7,291 $ 6,868 $ 8,080 $ 7,552
International Package ......... 2,639 2,240 2,771 2,246 2,676 2,422 3,047 2,791
Supply Chain & Freight ....... 1,987 1,749 2,164 1,794 2,225 1,863 2,294 2,034
Total revenue ............ 11,728 10,938 12,204 10,829 12,192 11,153 13,421 12,377
Operating profit:
U.S. Domestic Package ........ 562 384 748 476 1,020 514 1,043 764
International Package ......... 427 294 521 293 419 313 537 467
Supply Chain & Freight ....... 53 40 133 126 177 102 234 28
Total operating profit ..... 1,042 718 1,402 895 1,616 929 1,814 1,259
Net income ..................... $ 533 $ 401 $ 845 $ 445 $ 991 $ 549 $ 1,119 $ 757
Earnings per share:
Basic ...................... $ 0.54 $ 0.40 $ 0.85 $ 0.45 $ 1.00 $ 0.55 $ 1.13 $ 0.76
Diluted ..................... $ 0.53 $ 0.40 $ 0.84 $ 0.44 $ 0.99 $ 0.55 $ 1.11 $ 0.75
111