UPS 2010 Annual Report Download - page 38
Download and view the complete annual report
Please find page 38 of the 2010 UPS annual report below. You can navigate through the pages in the report by either clicking on the pages listed below, or by using the keyword search tool below to find specific information within the annual report.-
 1
1 -
2
-
3
-
4
-
5
-
6
-
7
-
8
-
9
-
10
-
11
-
12
-
13
-
14
-
15
-
16
-
17
-
18
-
19
-
20
-
21
-
22
-
23
-
24
-
25
-
26
-
27
-
 28
28 -
 29
29 -
 30
30 -
 31
31 -
 32
32 -
 33
33 -
 34
34 -
 35
35 -
 36
36 -
 37
37 -
 38
38 -
 39
39 -
 40
40 -
 41
41 -
 42
42 -
 43
43 -
 44
44 -
 45
45 -
 46
46 -
 47
47 -
 48
48 -
49
-
50
-
51
-
52
-
53
-
54
-
55
-
56
-
57
-
58
-
59
-
60
-
61
-
62
-
63
-
64
-
65
-
66
-
67
-
68
-
69
-
70
-
71
-
72
-
73
-
74
-
75
-
76
-
77
-
78
-
79
-
80
-
81
-
82
-
83
-
84
-
85
-
86
-
87
-
88
-
89
-
90
-
91
-
92
-
93
-
94
-
95
-
96
-
97
-
98
-
99
-
100
-
101
-
102
-
103
-
104
-
105
-
106
-
107
-
108
-
109
-
110
-
111
-
112
-
113
-
114
-
115
-
116
-
117
-
118
-
119
-
120
-
121
-
122
-
123
-
124
-
125
-
126
-
127
-
128
-
129
-
130
-
131
-
132
-
133
-
134
-
135
-
136
 |
 |

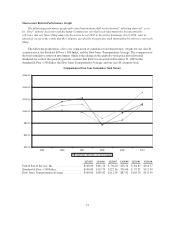
Volume trends improved in the fourth quarter, largely as a result of overall economic improvements, as
average daily volume for Next Day Air and Deferred products increased 2.8% and 4.3%, respectively, over 2008
levels. Ground volume demonstrated an improving trend over the previous quarters despite a 2.9% decline in the
fourth quarter compared with 2008.
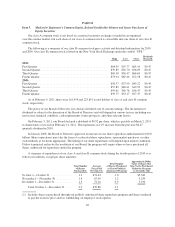
Revenue Per Piece
2010 compared to 2009
Overall revenue per piece increased for our ground and air products in 2010, largely due to a combination of
base price increases and fuel surcharge rate changes, which are discussed further below. The revenue per piece
for our air products also improved as a result of higher average package weights and the overall mix shift from
letters to packages. For both our air and ground products, revenue per piece was negatively affected by a shift in
product mix to our less premium services, such as Next Day Air Saver and Ground Basic.
Revenue per piece for our ground and air products was impacted by an increase in base rates that took effect
on January 4, 2010. We increased the base rates 6.9% on UPS Next Day Air, UPS 2nd Day Air, and UPS 3 Day
Select, and 4.9% on UPS Ground. Other pricing changes included an increase in the residential surcharge, and an
increase in the delivery area surcharge on both residential and commercial services to certain ZIP codes. These
rate changes are customary and occur on an annual basis.
2009 compared to 2008
Revenue per piece for our air products was negatively affected in 2009 by a decline in the fuel surcharge
rate for air products. Additionally, the revenue per piece decline for our air products was impacted by lower
average package weights and a mix shift toward lower yielding products, reflecting the economic recession in the
United States. The decline in revenue per piece for our ground products was primarily due to a decrease in the
fuel surcharge rate, but was also impacted by lower average package weights.
The factors decreasing revenue per piece for our ground and air products were partially offset by an increase
in base rates that took effect on January 5, 2009. We increased the base rates 6.9% on UPS Next Day Air, UPS
2nd Day Air, and UPS 3 Day Select, and 5.9% on UPS Ground. Other pricing changes included an increase in the
residential surcharge, and an increase in the delivery area surcharge on both residential and commercial services
to certain ZIP codes.
The trend towards lower package weights began to stabilize in the fourth quarter, however product mix
within our air and ground services continued to adversely impact revenue per piece, as the lower-yielding
products within those categories represented a larger share of our overall package volume.
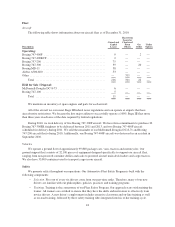
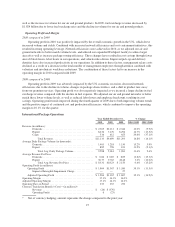
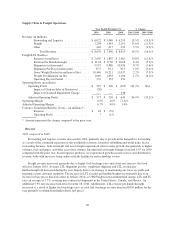
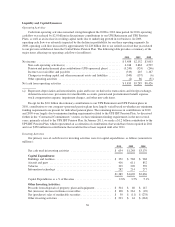
Fuel Surcharges
UPS applies a fuel surcharge on our domestic air and ground services. The air fuel surcharge is based on the
U.S. Energy Department’s Gulf Coast spot price for a gallon of kerosene-type jet fuel, while the ground fuel
surcharge is based on the U.S. Energy Department’s On-Highway Diesel Fuel Price. Based on published rates,
the average fuel surcharge for domestic air and ground products was as follows:
Year Ended December 31, % Point Change
2010 2009 2008 2010 / 2009 2009 / 2008
Next Day Air / Deferred ............. 8.0% 4.0% 25.2% 4.0% (21.2)%
Ground ........................... 5.6% 3.3% 8.0% 2.3% (4.7)%
On January 4, 2010 and January 5, 2009, we modified the fuel surcharge on air services by reducing the
index used to determine the fuel surcharge by 2% in each of the two years. The 2010 increase and 2009 decrease
in the air and ground fuel surcharges are due to the significant variations in jet and diesel fuel prices (in addition
to the reduction in the index on the air surcharge). Total domestic fuel surcharge revenue, net of the impact of
hedging, increased by $592 million in 2010, primarily due to the higher fuel surcharge rates described above, as
26