UPS 2010 Annual Report Download - page 51
Download and view the complete annual report
Please find page 51 of the 2010 UPS annual report below. You can navigate through the pages in the report by either clicking on the pages listed below, or by using the keyword search tool below to find specific information within the annual report.-
 1
1 -
2
-
3
-
4
-
5
-
6
-
7
-
8
-
9
-
10
-
11
-
12
-
13
-
14
-
15
-
16
-
17
-
18
-
19
-
20
-
21
-
22
-
23
-
24
-
25
-
26
-
27
-
28
-
29
-
30
-
31
-
32
-
33
-
34
-
35
-
36
-
37
-
38
-
39
-
40
-
 41
41 -
 42
42 -
 43
43 -
 44
44 -
 45
45 -
 46
46 -
 47
47 -
 48
48 -
 49
49 -
 50
50 -
 51
51 -
 52
52 -
 53
53 -
 54
54 -
 55
55 -
 56
56 -
 57
57 -
 58
58 -
 59
59 -
 60
60 -
 61
61 -
62
-
63
-
64
-
65
-
66
-
67
-
68
-
69
-
70
-
71
-
72
-
73
-
74
-
75
-
76
-
77
-
78
-
79
-
80
-
81
-
82
-
83
-
84
-
85
-
86
-
87
-
88
-
89
-
90
-
91
-
92
-
93
-
94
-
95
-
96
-
97
-
98
-
99
-
100
-
101
-
102
-
103
-
104
-
105
-
106
-
107
-
108
-
109
-
110
-
111
-
112
-
113
-
114
-
115
-
116
-
117
-
118
-
119
-
120
-
121
-
122
-
123
-
124
-
125
-
126
-
127
-
128
-
129
-
130
-
131
-
132
-
133
-
134
-
135
-
136
 |
 |
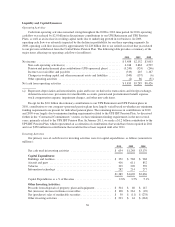
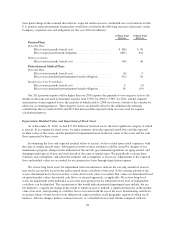
Other than commercial paper, repayments of debt consisted primarily of scheduled principal payments on
our capital lease obligations, redemption of facilities bonds and the UPS Notes program, and principal payments
on debt related to our investment in certain partnerships. We consider the overall fixed and floating interest rate
mix of our portfolio and the related overall cost of borrowing when planning for future issuances and
non-scheduled repayments of debt.
Cash received from common stock issuances to employees increased primarily due to additional stock
option exercises in 2010. The cash outflows in other financing activities is largely due to repurchases of shares
from employees to satisfy tax withholding obligations, as well as certain hedging activities on forecasted debt
issuances. In conjunction with the senior fixed rate debt offerings in 2010, 2009 and 2008, we settled several
interest rate derivatives that were designated as hedges of these debt offerings, which resulted in cash inflows
(outflows) of $11, ($243) and ($84) million, respectively.
Sources of Credit
We are authorized to borrow up to $10.0 billion under our U.S. commercial paper program. As of
December 31, 2010, we had $341 million of commercial paper outstanding, with an average interest rate of
0.18% and a weighted average maturity of 14 days. The amount of commercial paper outstanding in 2011 is
expected to fluctuate. We also maintain a European commercial paper program under which we are authorized to
borrow up to €1.0 billion in a variety of currencies, however no amounts were outstanding under this program as
of December 31, 2010.
We maintain two credit agreements with a consortium of banks. One of these agreements provides revolving
credit facilities of $1.5 billion, and expires on April 14, 2011. Interest on any amounts we borrow under this
facility would be charged at 90-day LIBOR plus a percentage determined by quotations from Markit Group Ltd.
for our 1-year credit default swap spread, subject to certain minimum rates and maximum rates based on our
public debt ratings from Standard & Poor’s and Moody’s. If our public debt ratings are A / A2 or above, the
minimum applicable margin is 0.50% and the maximum applicable margin is 1.50%; if our public debt ratings
are lower than A / A2, the minimum applicable margin is 1.00% and the maximum applicable margin is 2.50%.
The second agreement provides revolving credit facilities of $1.0 billion, and expires on April 19, 2012.
Interest on any amounts we borrow under this facility would be charged at 90-day LIBOR plus 15 basis points.
At December 31, 2010, there were no outstanding borrowings under either of these facilities.
Our existing debt instruments and credit facilities do not have cross-default or ratings triggers, however
these debt instruments and credit facilities do subject us to certain financial covenants. As of December 31, 2010
and for all prior periods presented, we have satisfied these financial covenants. These covenants limit the amount
of secured indebtedness that we may incur, and limit the amount of attributable debt in sale-leaseback
transactions, to 10% of net tangible assets. As of December 31, 2010, 10% of net tangible assets is equivalent to
$2.501 billion, however we have no covered sale-leaseback transactions or secured indebtedness outstanding.
Additionally, we are required to maintain a minimum net worth, as defined, of $5.0 billion on a quarterly basis.
As of December 31, 2010, our net worth, as defined, was equivalent to $14.174 billion. We do not expect these
covenants to have a material impact on our financial condition or liquidity.
Guarantees and Other Off-Balance Sheet Arrangements
We do not have guarantees or other off-balance sheet financing arrangements, including variable interest
entities, which we believe could have a material impact on financial condition or liquidity.
39