UPS 2010 Annual Report Download - page 48
Download and view the complete annual report
Please find page 48 of the 2010 UPS annual report below. You can navigate through the pages in the report by either clicking on the pages listed below, or by using the keyword search tool below to find specific information within the annual report.-
 1
1 -
2
-
3
-
4
-
5
-
6
-
7
-
8
-
9
-
10
-
11
-
12
-
13
-
14
-
15
-
16
-
17
-
18
-
19
-
20
-
21
-
22
-
23
-
24
-
25
-
26
-
27
-
28
-
29
-
30
-
31
-
32
-
33
-
34
-
35
-
36
-
37
-
 38
38 -
 39
39 -
 40
40 -
 41
41 -
 42
42 -
 43
43 -
 44
44 -
 45
45 -
 46
46 -
 47
47 -
 48
48 -
 49
49 -
 50
50 -
 51
51 -
 52
52 -
 53
53 -
 54
54 -
 55
55 -
 56
56 -
 57
57 -
 58
58 -
59
-
60
-
61
-
62
-
63
-
64
-
65
-
66
-
67
-
68
-
69
-
70
-
71
-
72
-
73
-
74
-
75
-
76
-
77
-
78
-
79
-
80
-
81
-
82
-
83
-
84
-
85
-
86
-
87
-
88
-
89
-
90
-
91
-
92
-
93
-
94
-
95
-
96
-
97
-
98
-
99
-
100
-
101
-
102
-
103
-
104
-
105
-
106
-
107
-
108
-
109
-
110
-
111
-
112
-
113
-
114
-
115
-
116
-
117
-
118
-
119
-
120
-
121
-
122
-
123
-
124
-
125
-
126
-
127
-
128
-
129
-
130
-
131
-
132
-
133
-
134
-
135
-
136
 |
 |

Liquidity and Capital Resources
Operating Activities
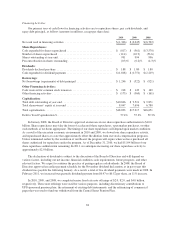
Cash from operating activities remained strong throughout the 2008 to 2010 time period. In 2010, operating
cash flow was reduced by $2.0 billion in discretionary contributions to our UPS Retirement and UPS Pension
Plans, as well as an increase in working capital needs due to underlying growth in our business. In 2009,
operating cash flow was adversely impacted by the decline in profitability for our three reporting segments. In
2008, operating cash flow increased by approximately $1.228 billion due to tax refunds received that year related
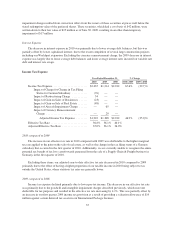
to our previous withdrawal from the Central States Pension Plan. The following table provides a summary of the
major items affecting our operating cash flows (in millions):
2010 2009 2008
Net income .......................................................... $3,488 $2,152 $3,003
Non-cash operating activities(a) ...................................... 4,248 3,863 4,539
Pension and postretirement plan contributions (UPS-sponsored plans) ........ (3,240) (924) (246)
Income tax receivables and payables .................................. (319) 245 1,167
Changes in working capital and other noncurrent assets and liabilities ........ (340) (137) (6)
Other operating activities ........................................... (2) 86 (31)
Net cash from operating activities ........................................ $3,835 $5,285 $8,426
(a) Represents depreciation and amortization, gains and losses on derivative transactions and foreign exchange,
deferred income taxes, provisions for uncollectible accounts, pension and postretirement benefit expense,
stock compensation expense, impairment charges, and other non-cash items.
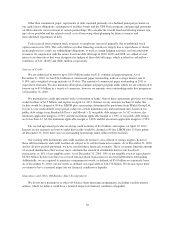
Except for the $2.0 billion discretionary contributions to our UPS Retirement and UPS Pension plans in
2010, contributions to our company-sponsored pension plans have largely varied based on whether any minimum
funding requirements are present for individual pension plans. The remaining increases in contributions in 2010
and 2009 were largely due to minimum funding requirements related to the UPS IBT Pension Plan. As discussed
further in the “Contractual Commitments” section, we have minimum funding requirements in the next several
years, primarily related to the UPS IBT Pension Plan. In January 2011, we made a $1.2 billion contribution to the
UPS IBT Pension Plan, which represented an acceleration of contributions that would have been required in 2011
and over $350 million in contributions that would not have been required until after 2011.
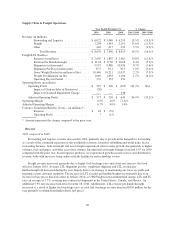
Investing Activities
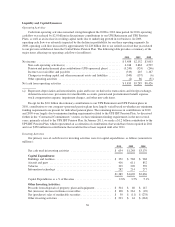
Our primary uses of cash flows for investing activities were for capital expenditures, as follows (amounts in
millions):
2010 2009 2008
Net cash used in investing activities ............................ $ 654 $1,248 $3,179
Capital Expenditures:
Buildings and facilities ....................................... $ 352 $ 568 $ 968
Aircraft and parts ........................................... 416 611 852
Vehicles .................................................. 339 209 539
Information technology ...................................... 282 214 277
$1,389 $1,602 $2,636
Capital Expenditures as a % of Revenue ......................... 2.8% 3.5% 5.1%
Other Investing Activities:
Proceeds from disposals of property, plant and equipment ........... $ 304 $ 60 $ 147
Net (increase) decrease in finance receivables ..................... $ 108 $ 261 $ (49)
Net (purchases) sales of marketable securities ..................... $ 30 $ (11) $ (278)
Other investing activities ..................................... $ 293 $ 44 $ (363)
36