UPS 2010 Annual Report Download - page 60
Download and view the complete annual report
Please find page 60 of the 2010 UPS annual report below. You can navigate through the pages in the report by either clicking on the pages listed below, or by using the keyword search tool below to find specific information within the annual report.-
 1
1 -
2
-
3
-
4
-
5
-
6
-
7
-
8
-
9
-
10
-
11
-
12
-
13
-
14
-
15
-
16
-
17
-
18
-
19
-
20
-
21
-
22
-
23
-
24
-
25
-
26
-
27
-
28
-
29
-
30
-
31
-
32
-
33
-
34
-
35
-
36
-
37
-
38
-
39
-
40
-
41
-
42
-
43
-
44
-
45
-
46
-
47
-
48
-
49
-
 50
50 -
 51
51 -
 52
52 -
 53
53 -
 54
54 -
 55
55 -
 56
56 -
 57
57 -
 58
58 -
 59
59 -
 60
60 -
 61
61 -
 62
62 -
 63
63 -
 64
64 -
 65
65 -
 66
66 -
 67
67 -
 68
68 -
 69
69 -
 70
70 -
71
-
72
-
73
-
74
-
75
-
76
-
77
-
78
-
79
-
80
-
81
-
82
-
83
-
84
-
85
-
86
-
87
-
88
-
89
-
90
-
91
-
92
-
93
-
94
-
95
-
96
-
97
-
98
-
99
-
100
-
101
-
102
-
103
-
104
-
105
-
106
-
107
-
108
-
109
-
110
-
111
-
112
-
113
-
114
-
115
-
116
-
117
-
118
-
119
-
120
-
121
-
122
-
123
-
124
-
125
-
126
-
127
-
128
-
129
-
130
-
131
-
132
-
133
-
134
-
135
-
136
 |
 |

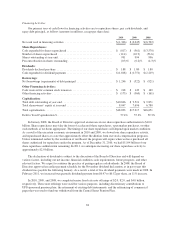
basis point change in the assumed discount rate, expected return on assets, and health care cost trend rate for the
U.S. pension and postretirement benefit plans would have resulted in the following increases (decreases) on the
Company’s reported costs and obligations for the year 2010 (in millions):
25 Basis Point
Increase
25 Basis Point
Decrease
Pension Plans
Discount Rate:
Effect on net periodic benefit cost .......................... $ (86) $ 96
Effect on projected benefit obligation ....................... (805) 854
Return on Assets:
Effect on net periodic benefit cost .......................... (46) 46
Postretirement Medical Plans
Discount Rate:
Effect on net periodic benefit cost .......................... (6) 5
Effect on accumulated postretirement benefit obligation ......... (92) 96
Health Care Cost Trend Rate:
Effect on net periodic benefit cost .......................... 3 (3)
Effect on accumulated postretirement benefit obligation ......... 18 (19)
Our 2011 pension expense will be higher than our 2010 expense due primarily to two negative factors: the
decline in discount rate used to determine expense from 6.58% for 2010 to 5.98% for 2011, and the required
amortization of unrecognized losses, the majority of which relate to 2008 asset losses, outside of the corridor we
utilize for accounting purposes. These negative factors are partially offset by the additional discretionary
contributions that we made in 2010 and 2011 that increased the expected return on assets used for expense
calculation purposes.
Depreciation, Residual Value, and Impairment of Fixed Assets
As of December 31, 2010, we had $17.387 billion of net fixed assets, the most significant category of which
is aircraft. In accounting for fixed assets, we make estimates about the expected useful lives and the expected
residual values of the assets, and the potential for impairment based on the fair values of the assets and the cash
flows generated by these assets.
In estimating the lives and expected residual values of aircraft, we have relied upon actual experience with
the same or similar aircraft types. Subsequent revisions to these estimates could be caused by changes to our
maintenance program, changes in the utilization of the aircraft, governmental regulations on aging aircraft, and
changing market prices of new and used aircraft of the same or similar types. We periodically evaluate these
estimates and assumptions, and adjust the estimates and assumptions as necessary. Adjustments to the expected
lives and residual values are accounted for on a prospective basis through depreciation expense.
We review long-lived assets for impairment when circumstances indicate the carrying amount of an asset
may not be recoverable based on the undiscounted future cash flows of the asset. If the carrying amount of the
asset is determined not to be recoverable, a write-down to fair value is recorded. Fair values are determined based
on quoted market values, discounted cash flows, or external appraisals, as applicable. We review long-lived
assets for impairment at the individual asset or the asset group level for which the lowest level of independent
cash flows can be identified. The circumstances that would indicate potential impairment may include, but are
not limited to, a significant change in the extent to which an asset is utilized, a significant decrease in the market
value of an asset, and operating or cash flow losses associated with the use of the asset. In estimating cash flows,
we project future volume levels for our different air express products in all geographic regions in which we do
business. Adverse changes in these volume forecasts, or a shortfall of our actual volume compared with our
48