UPS 2010 Annual Report Download - page 76
Download and view the complete annual report
Please find page 76 of the 2010 UPS annual report below. You can navigate through the pages in the report by either clicking on the pages listed below, or by using the keyword search tool below to find specific information within the annual report.-
 1
1 -
2
-
3
-
4
-
5
-
6
-
7
-
8
-
9
-
10
-
11
-
12
-
13
-
14
-
15
-
16
-
17
-
18
-
19
-
20
-
21
-
22
-
23
-
24
-
25
-
26
-
27
-
28
-
29
-
30
-
31
-
32
-
33
-
34
-
35
-
36
-
37
-
38
-
39
-
40
-
41
-
42
-
43
-
44
-
45
-
46
-
47
-
48
-
49
-
50
-
51
-
52
-
53
-
54
-
55
-
56
-
57
-
58
-
59
-
60
-
61
-
62
-
63
-
64
-
65
-
 66
66 -
 67
67 -
 68
68 -
 69
69 -
 70
70 -
 71
71 -
 72
72 -
 73
73 -
 74
74 -
 75
75 -
 76
76 -
 77
77 -
 78
78 -
 79
79 -
 80
80 -
 81
81 -
 82
82 -
 83
83 -
 84
84 -
 85
85 -
 86
86 -
87
-
88
-
89
-
90
-
91
-
92
-
93
-
94
-
95
-
96
-
97
-
98
-
99
-
100
-
101
-
102
-
103
-
104
-
105
-
106
-
107
-
108
-
109
-
110
-
111
-
112
-
113
-
114
-
115
-
116
-
117
-
118
-
119
-
120
-
121
-
122
-
123
-
124
-
125
-
126
-
127
-
128
-
129
-
130
-
131
-
132
-
133
-
134
-
135
-
136
 |
 |

UNITED PARCEL SERVICE, INC. AND SUBSIDIARIES
NOTES TO CONSOLIDATED FINANCIAL STATEMENTS—(Continued)
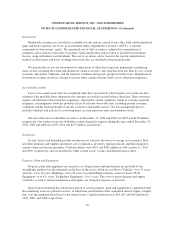
Accounting Standards Issued But Not Yet Effective
Accounting pronouncements issued, but not effective until after December 31, 2010, are not expected to
have a significant effect on our consolidated financial position or results or operations.
Changes in Presentation
Certain prior year amounts have been reclassified to conform to the current year presentation. These
reclassifications had no impact on our financial position or results of operations.
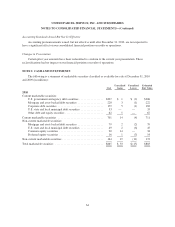
NOTE 2. CASH AND INVESTMENTS
The following is a summary of marketable securities classified as available-for-sale at December 31, 2010
and 2009 (in millions):
Cost
Unrealized
Gains
Unrealized
Losses
Estimated
Fair Value
2010
Current marketable securities:
U.S. government and agency debt securities ................. $207 $ 1 $ (2) $206
Mortgage and asset-backed debt securities .................. 220 3 (1) 222
Corporate debt securities ................................ 179 5 (1) 183
U.S. state and local municipal debt securities ................ 33 — — 33
Other debt and equity securities ........................... 62 5 — 67
Current marketable securities ................................ 701 14 (4) 711
Non-current marketable securities:
Mortgage and asset-backed debt securities .................. 79 2 (2) 79
U.S. state and local municipal debt securities ................ 49 2 (6) 45
Common equity securities ............................... 20 14 — 34
Preferred equity securities ............................... 16 1 (3) 14
Non-current marketable securities ............................. 164 19 (11) 172
Total marketable securities .................................. $865 $ 33 $ (15) $883
64