UPS 2010 Annual Report Download - page 83
Download and view the complete annual report
Please find page 83 of the 2010 UPS annual report below. You can navigate through the pages in the report by either clicking on the pages listed below, or by using the keyword search tool below to find specific information within the annual report.-
 1
1 -
2
-
3
-
4
-
5
-
6
-
7
-
8
-
9
-
10
-
11
-
12
-
13
-
14
-
15
-
16
-
17
-
18
-
19
-
20
-
21
-
22
-
23
-
24
-
25
-
26
-
27
-
28
-
29
-
30
-
31
-
32
-
33
-
34
-
35
-
36
-
37
-
38
-
39
-
40
-
41
-
42
-
43
-
44
-
45
-
46
-
47
-
48
-
49
-
50
-
51
-
52
-
53
-
54
-
55
-
56
-
57
-
58
-
59
-
60
-
61
-
62
-
63
-
64
-
65
-
66
-
67
-
68
-
69
-
70
-
71
-
72
-
 73
73 -
 74
74 -
 75
75 -
 76
76 -
 77
77 -
 78
78 -
 79
79 -
 80
80 -
 81
81 -
 82
82 -
 83
83 -
 84
84 -
 85
85 -
 86
86 -
 87
87 -
 88
88 -
 89
89 -
 90
90 -
 91
91 -
 92
92 -
 93
93 -
94
-
95
-
96
-
97
-
98
-
99
-
100
-
101
-
102
-
103
-
104
-
105
-
106
-
107
-
108
-
109
-
110
-
111
-
112
-
113
-
114
-
115
-
116
-
117
-
118
-
119
-
120
-
121
-
122
-
123
-
124
-
125
-
126
-
127
-
128
-
129
-
130
-
131
-
132
-
133
-
134
-
135
-
136
 |
 |

UNITED PARCEL SERVICE, INC. AND SUBSIDIARIES
NOTES TO CONSOLIDATED FINANCIAL STATEMENTS—(Continued)
•Acceptable Risk—Payments are current, and no loss is likely.
•Sub-Standard Risk—In default or high probability of default, but loss is unlikely.
•Classified—In default, loss is probable, specific allowance for loss is assigned.
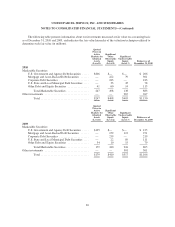
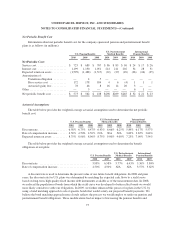
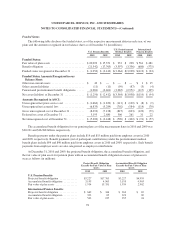
The following is an allocation of the finance receivables portfolio by risk rating category as of
December 31, 2010 (in millions):
Commercial
Lending
Other
Financing
Receivables Total
U.S. Government guaranteed ......................................... $ 98 $— $ 98
Acceptable risk .................................................... 145 235 380
Sub-standard risk .................................................. 12 5 17
Classified ........................................................ 11 5 16
$266 $245 $511
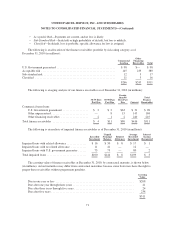
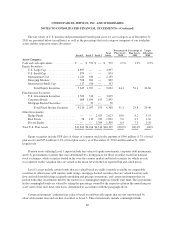
The following is an aging analysis of our finance receivables as of December 31, 2010 (in millions):
30-59 Days
Past Due
60-90 Days
Past Due
Greater
than 90
Days Past
Due Current
Total
Finance
Receivables
Commercial term loans:
U.S. Government guaranteed .................. $ 2 $ 2 $63 $ 31 $ 98
Other unguaranteed .......................... — 8 15 145 168
Other financing receivables ................... 2 1 2 240 245
Total finance receivables ......................... $ 4 $11 $80 $416 $511
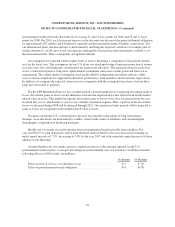
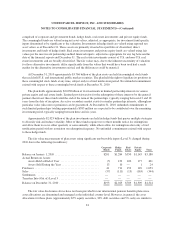
The following is an analysis of impaired finance receivables as of December 31, 2010 (in millions):
Recorded
Investment
Unpaid
Principal
Balance
Related
Allowance
Average
Recorded
Investment
Interest
Income
Recognized
Impaired loans with related allowance .............. $ 16 $ 30 $ 8 $ 17 $ 1
Impaired loans with no related allowance ........... 11 41 — 12 —
Impaired loans with U.S. government guarantee ...... 73 73 — 80 2
Total impaired loans ............................ $100 $144 $ 8 $109 $ 3
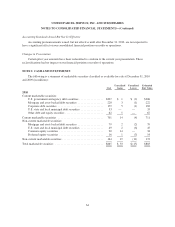
The carrying value of finance receivables at December 31, 2010, by contractual maturity, is shown below
(in millions). Actual maturities may differ from contractual maturities because some borrowers have the right to
prepay these receivables without prepayment penalties.
Carrying
Value
Due in one year or less ....................................................... $208
Due after one year through three years ........................................... 41
Due after three years through five years .......................................... 24
Due after five years .......................................................... 238
$511
71