UPS 2010 Annual Report Download - page 43
Download and view the complete annual report
Please find page 43 of the 2010 UPS annual report below. You can navigate through the pages in the report by either clicking on the pages listed below, or by using the keyword search tool below to find specific information within the annual report.-
 1
1 -
2
-
3
-
4
-
5
-
6
-
7
-
8
-
9
-
10
-
11
-
12
-
13
-
14
-
15
-
16
-
17
-
18
-
19
-
20
-
21
-
22
-
23
-
24
-
25
-
26
-
27
-
28
-
29
-
30
-
31
-
32
-
 33
33 -
 34
34 -
 35
35 -
 36
36 -
 37
37 -
 38
38 -
 39
39 -
 40
40 -
 41
41 -
 42
42 -
 43
43 -
 44
44 -
 45
45 -
 46
46 -
 47
47 -
 48
48 -
 49
49 -
 50
50 -
 51
51 -
 52
52 -
 53
53 -
54
-
55
-
56
-
57
-
58
-
59
-
60
-
61
-
62
-
63
-
64
-
65
-
66
-
67
-
68
-
69
-
70
-
71
-
72
-
73
-
74
-
75
-
76
-
77
-
78
-
79
-
80
-
81
-
82
-
83
-
84
-
85
-
86
-
87
-
88
-
89
-
90
-
91
-
92
-
93
-
94
-
95
-
96
-
97
-
98
-
99
-
100
-
101
-
102
-
103
-
104
-
105
-
106
-
107
-
108
-
109
-
110
-
111
-
112
-
113
-
114
-
115
-
116
-
117
-
118
-
119
-
120
-
121
-
122
-
123
-
124
-
125
-
126
-
127
-
128
-
129
-
130
-
131
-
132
-
133
-
134
-
135
-
136
 |
 |
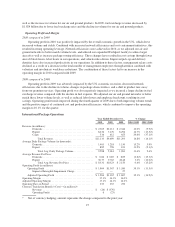
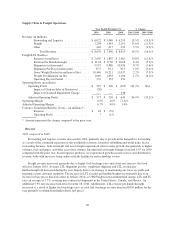
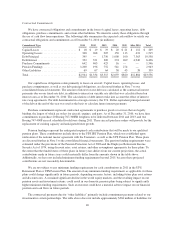
The other businesses within Supply Chain & Freight experienced an increase in revenue. A primary driver
of this increase was our UPS Customer Solutions business, which provides a range of services (e.g. project
management, industrial engineering, transportation fleet services, distribution network analysis, package
engineering, and package visibility).
2009 compared to 2008
Forwarding and logistics revenue decreased for the year, and was caused primarily by weakness in demand
for freight forwarding due to global economic weakness and declines in international trade. Forwarding revenue
declined in all major transportation modes, including domestic and international air freight and ocean freight, and
was impacted by lower volumes, lower fuel surcharges, and lower security and other accessorial charges.
Logistics distribution and post-sales service revenue also declined, primarily resulting from the weak global
economy, however mail services revenue increased for the year.
Freight revenue declined, primarily due to lower fuel surcharge rates and a decline in average daily LTL
shipments. Total LTL weight per shipment declined for the year, reflecting the weak LTL market and the
ongoing economic recession in the United States in 2009. Average LTL shipments per day also declined, as
market share gains were more than offset by the impact of the weak economy. LTL revenue per hundredweight
decreased, primarily as a result of the lower fuel surcharge rates, as total fuel surcharge revenue declined $188
million for the year primarily resulting from lower diesel fuel prices. However, this decline was partially offset
by an increase in base prices that took effect on January 5, 2009, as UPS Freight increased minimum charge,
LTL and TL rates an average of 5.9%, covering non-contractual shipments in the United States and Canada.
The other businesses within Supply Chain & Freight, which include our retail franchising business and our
financial business, experienced a decline in revenue, primarily caused by lower interest rates and decreased loan
volume in our financial business.
Revenue trends for our forwarding, logistics, and LTL products improved in the fourth quarter of 2009,
largely resulting from favorable comparisons with the prior year. The change in revenue for our forwarding and
logistics businesses benefited from the weaker U.S. Dollar during the quarter, while revenue in the forwarding
and LTL units continued to be adversely impacted by lower fuel surcharge revenue.
Operating Profit and Margin
2010 compared to 2009
Operating profit in the forwarding unit increased during 2010, largely due to a strong increase in tonnage in
our air and ocean forwarding businesses, but was partially offset by capacity constraints from outside carriers in
the first half of 2010. Capacity constraints led to rapidly escalating rates on air freight which could not be passed
on to customers in a timely manner, resulting in a negative impact to our operating profit and margin. This
situation improved during the second half of 2010, as capacity constraints lessened and we were able to
implement revenue management plans which better matched customer pricing with market conditions. Our
logistics unit had a solid increase in profitability for the year, which was driven primarily by an expansion of
operating margins due to operating efficiencies and a focus on higher margin industry sectors.
Operating profit for our UPS Freight unit increased in 2010 compared with the prior year, largely due to
better productivity, and increases in base pricing and volume. Productivity metrics increased, including increases
in pickup and delivery stops per hour and linehaul utilization.
All of the remaining businesses within this segment had an operating profit during the year. Combined
operating profit for these businesses was lower in 2010 than in 2009, primarily due to the gain on sale of
substantially all our international Mail Boxes Etc. operations during the second quarter of 2009.
31