UPS 2010 Annual Report Download - page 111
Download and view the complete annual report
Please find page 111 of the 2010 UPS annual report below. You can navigate through the pages in the report by either clicking on the pages listed below, or by using the keyword search tool below to find specific information within the annual report.-
 1
1 -
2
-
3
-
4
-
5
-
6
-
7
-
8
-
9
-
10
-
11
-
12
-
13
-
14
-
15
-
16
-
17
-
18
-
19
-
20
-
21
-
22
-
23
-
24
-
25
-
26
-
27
-
28
-
29
-
30
-
31
-
32
-
33
-
34
-
35
-
36
-
37
-
38
-
39
-
40
-
41
-
42
-
43
-
44
-
45
-
46
-
47
-
48
-
49
-
50
-
51
-
52
-
53
-
54
-
55
-
56
-
57
-
58
-
59
-
60
-
61
-
62
-
63
-
64
-
65
-
66
-
67
-
68
-
69
-
70
-
71
-
72
-
73
-
74
-
75
-
76
-
77
-
78
-
79
-
80
-
81
-
82
-
83
-
84
-
85
-
86
-
87
-
88
-
89
-
90
-
91
-
92
-
93
-
94
-
95
-
96
-
97
-
98
-
99
-
100
-
 101
101 -
 102
102 -
 103
103 -
 104
104 -
 105
105 -
 106
106 -
 107
107 -
 108
108 -
 109
109 -
 110
110 -
 111
111 -
 112
112 -
 113
113 -
 114
114 -
 115
115 -
 116
116 -
 117
117 -
 118
118 -
 119
119 -
 120
120 -
 121
121 -
122
-
123
-
124
-
125
-
126
-
127
-
128
-
129
-
130
-
131
-
132
-
133
-
134
-
135
-
136
 |
 |

UNITED PARCEL SERVICE, INC. AND SUBSIDIARIES
NOTES TO CONSOLIDATED FINANCIAL STATEMENTS—(Continued)
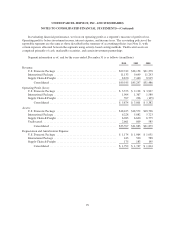
In evaluating financial performance, we focus on operating profit as a segment’s measure of profit or loss.
Operating profit is before investment income, interest expense, and income taxes. The accounting policies of the
reportable segments are the same as those described in the summary of accounting policies (see Note 1), with
certain expenses allocated between the segments using activity-based costing methods. Unallocated assets are
comprised primarily of cash, marketable securities, and certain investment partnerships.
Segment information as of, and for the years ended, December 31 is as follows (in millions):
2010 2009 2008
Revenue:
U.S. Domestic Package .......................................... $29,742 $28,158 $31,278
International Package ............................................ 11,133 9,699 11,293
Supply Chain & Freight .......................................... 8,670 7,440 8,915
Consolidated ............................................... $49,545 $45,297 $51,486
Operating Profit (Loss):
U.S. Domestic Package .......................................... $ 3,373 $ 2,138 $ 3,907
International Package ............................................ 1,904 1,367 1,580
Supply Chain & Freight .......................................... 597 296 (105)
Consolidated ............................................... $ 5,874 $ 3,801 $ 5,382
Assets:
U.S. Domestic Package .......................................... $18,425 $18,572 $18,796
International Package ............................................ 6,228 5,882 5,723
Supply Chain & Freight .......................................... 6,283 6,620 6,775
Unallocated .................................................... 2,661 809 585
Consolidated ............................................... $33,597 $31,883 $31,879
Depreciation and Amortization Expense:
U.S. Domestic Package .......................................... $ 1,174 $ 1,064 $ 1,031
International Package ............................................ 443 500 588
Supply Chain & Freight .......................................... 175 183 195
Consolidated ............................................... $ 1,792 $ 1,747 $ 1,814
99