UPS 2010 Annual Report Download - page 7
Download and view the complete annual report
Please find page 7 of the 2010 UPS annual report below. You can navigate through the pages in the report by either clicking on the pages listed below, or by using the keyword search tool below to find specific information within the annual report.-
 1
1 -
 2
2 -
 3
3 -
 4
4 -
 5
5 -
 6
6 -
 7
7 -
 8
8 -
 9
9 -
 10
10 -
 11
11 -
 12
12 -
 13
13 -
 14
14 -
 15
15 -
 16
16 -
 17
17 -
 18
18 -
19
-
20
-
21
-
22
-
23
-
24
-
25
-
26
-
27
-
28
-
29
-
30
-
31
-
32
-
33
-
34
-
35
-
36
-
37
-
38
-
39
-
40
-
41
-
42
-
43
-
44
-
45
-
46
-
47
-
48
-
49
-
50
-
51
-
52
-
53
-
54
-
55
-
56
-
57
-
58
-
59
-
60
-
61
-
62
-
63
-
64
-
65
-
66
-
67
-
68
-
69
-
70
-
71
-
72
-
73
-
74
-
75
-
76
-
77
-
78
-
79
-
80
-
81
-
82
-
83
-
84
-
85
-
86
-
87
-
88
-
89
-
90
-
91
-
92
-
93
-
94
-
95
-
96
-
97
-
98
-
99
-
100
-
101
-
102
-
103
-
104
-
105
-
106
-
107
-
108
-
109
-
110
-
111
-
112
-
113
-
114
-
115
-
116
-
117
-
118
-
119
-
120
-
121
-
122
-
123
-
124
-
125
-
126
-
127
-
128
-
129
-
130
-
131
-
132
-
133
-
134
-
135
-
136
 |
 |

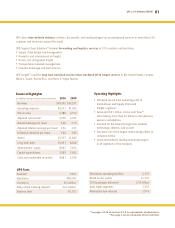
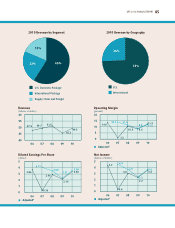
2010 Revenue by Geography
U.S.
International
74%
26%
2010 Revenue by Segment
U.S. Domestic Package
International Package
Supply Chain and Freight
60%
18%
22%
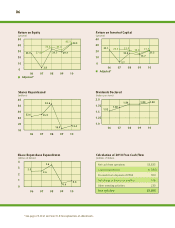
Net Income
(billions of dollars)
3
4
5
2
1
0
06 07 08 09 10
4.2
0.4
3.0
3.6
4.4
2.2
2.3
Adjusted*
Diluted Earnings Per Share
(dollars)
3
4
5
2
1
0
06 07 08 09 10
3.86
0.36
2.94
3.50
4.11
2.14
2.31
Adjusted*
Revenue
(billions of dollars)
55
60
50
45
40
06 07 08 09 10
47.5 49.7 51.5
45.3
UPS 2010 ANNUAL REPORT 05
15
20
10
5
0
06 07 08 09 10
14.0
1.2
10.5
11.6
14.1
8.4
8.8
Adjusted*
Operating Margin
(percent)
49.5
3.6
3.48
3.56
11.9
11.8
3.5