UPS 2010 Annual Report Download - page 37
Download and view the complete annual report
Please find page 37 of the 2010 UPS annual report below. You can navigate through the pages in the report by either clicking on the pages listed below, or by using the keyword search tool below to find specific information within the annual report.-
 1
1 -
2
-
3
-
4
-
5
-
6
-
7
-
8
-
9
-
10
-
11
-
12
-
13
-
14
-
15
-
16
-
17
-
18
-
19
-
20
-
21
-
22
-
23
-
24
-
25
-
26
-
 27
27 -
 28
28 -
 29
29 -
 30
30 -
 31
31 -
 32
32 -
 33
33 -
 34
34 -
 35
35 -
 36
36 -
 37
37 -
 38
38 -
 39
39 -
 40
40 -
 41
41 -
 42
42 -
 43
43 -
 44
44 -
 45
45 -
 46
46 -
 47
47 -
48
-
49
-
50
-
51
-
52
-
53
-
54
-
55
-
56
-
57
-
58
-
59
-
60
-
61
-
62
-
63
-
64
-
65
-
66
-
67
-
68
-
69
-
70
-
71
-
72
-
73
-
74
-
75
-
76
-
77
-
78
-
79
-
80
-
81
-
82
-
83
-
84
-
85
-
86
-
87
-
88
-
89
-
90
-
91
-
92
-
93
-
94
-
95
-
96
-
97
-
98
-
99
-
100
-
101
-
102
-
103
-
104
-
105
-
106
-
107
-
108
-
109
-
110
-
111
-
112
-
113
-
114
-
115
-
116
-
117
-
118
-
119
-
120
-
121
-
122
-
123
-
124
-
125
-
126
-
127
-
128
-
129
-
130
-
131
-
132
-
133
-
134
-
135
-
136
 |
 |

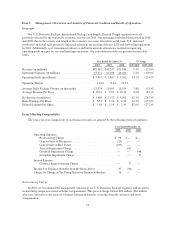
future performance. We believe these adjusted financial measures are important indicators of our recurring
results of operations because they exclude items that may not be indicative of, or are unrelated to, our core
operating results, and provide a better baseline for analyzing trends in our underlying businesses.
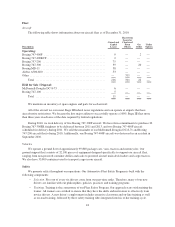
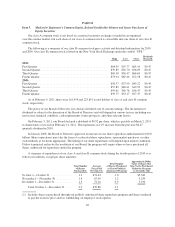
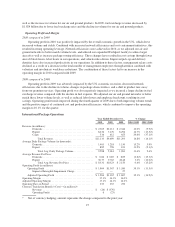
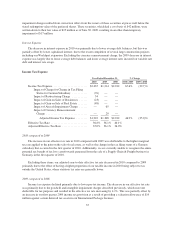
U.S. Domestic Package Operations
Year Ended December 31, % Change
2010 2009 2008 2010 / 2009 2009 / 2008
Revenue (in millions):
Next Day Air ........................... $ 5,835 $ 5,456 $ 6,559 6.9% (16.8)%
Deferred ............................... 2,975 2,859 3,325 4.1% (14.0)%
Ground ................................ 20,932 19,843 21,394 5.5% (7.2)%
Total Revenue ...................... $29,742 $28,158 $31,278 5.6% (10.0)%
Average Daily Package Volume (in thousands):
Next Day Air ........................... 1,205 1,198 1,186 0.6% 1.0%
Deferred ............................... 941 957 947 (1.7)% 1.1%
Ground ................................ 11,140 10,895 11,443 2.2% (4.8)%
Total Avg. Daily Package Volume ...... 13,286 13,050 13,576 1.8% (3.9)%
Average Revenue Per Piece:
Next Day Air ........................... $ 19.14 $ 18.00 $ 21.95 6.3% (18.0)%
Deferred ............................... 12.50 11.81 13.93 5.8% (15.2)%
Ground ................................ 7.43 7.20 7.42 3.2% (3.0)%
Total Avg. Revenue Per Piece .......... $ 8.85 $ 8.53 $ 9.14 3.8% (6.7)%
Operating Profit (in millions):
Operating Profit ............................. $ 3,373 $ 2,138 $ 3,907 57.8% (45.3)%
Impact of Restructuring Charge ............ 98 — —
Impact of Gain on Sale of Real Estate ........ (109) — —
Impact of Aircraft Impairment Charge ....... — 181 —
Adjusted Operating Profit ..................... $ 3,362 $ 2,319 $ 3,907 45.0% (40.6)%
Operating Margin ................................ 11.3% 7.6% 12.5%
Adjusted Operating Margin ........................ 11.3% 8.2% 12.5%
Operating Days in Period .......................... 253 253 252
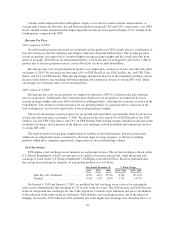
Volume
2010 compared to 2009
In 2010, our overall volume increased as improvements in industrial production and retail sales increased
overall demand in the U.S. small package market. Among our air products, package volume increased as
inventory rebuilding in the manufacturing and retailing sectors contributed to growth. However, our letter
volume declined largely due to weakness in the financial and other service industries. The growth in ground
volume was driven by increased volume from the manufacturing and retailing sectors.
2009 compared to 2008
In 2009, our overall volume declined as decreases in industrial production and retail sales reduced overall
demand in the U.S. small package market. Our air product volume was stronger than our ground volume, as our
air volume benefited from market share gains resulting from the departure of a competitor in the U.S. market, as
well as improving economic trends in the latter half of the year. The growth in air volume was strongest in our
less time-sensitive products, such as Next Day Air Saver and Three Day Select.
25