UPS 2010 Annual Report Download - page 40
Download and view the complete annual report
Please find page 40 of the 2010 UPS annual report below. You can navigate through the pages in the report by either clicking on the pages listed below, or by using the keyword search tool below to find specific information within the annual report.-
 1
1 -
2
-
3
-
4
-
5
-
6
-
7
-
8
-
9
-
10
-
11
-
12
-
13
-
14
-
15
-
16
-
17
-
18
-
19
-
20
-
21
-
22
-
23
-
24
-
25
-
26
-
27
-
28
-
29
-
 30
30 -
 31
31 -
 32
32 -
 33
33 -
 34
34 -
 35
35 -
 36
36 -
 37
37 -
 38
38 -
 39
39 -
 40
40 -
 41
41 -
 42
42 -
 43
43 -
 44
44 -
 45
45 -
 46
46 -
 47
47 -
 48
48 -
 49
49 -
 50
50 -
51
-
52
-
53
-
54
-
55
-
56
-
57
-
58
-
59
-
60
-
61
-
62
-
63
-
64
-
65
-
66
-
67
-
68
-
69
-
70
-
71
-
72
-
73
-
74
-
75
-
76
-
77
-
78
-
79
-
80
-
81
-
82
-
83
-
84
-
85
-
86
-
87
-
88
-
89
-
90
-
91
-
92
-
93
-
94
-
95
-
96
-
97
-
98
-
99
-
100
-
101
-
102
-
103
-
104
-
105
-
106
-
107
-
108
-
109
-
110
-
111
-
112
-
113
-
114
-
115
-
116
-
117
-
118
-
119
-
120
-
121
-
122
-
123
-
124
-
125
-
126
-
127
-
128
-
129
-
130
-
131
-
132
-
133
-
134
-
135
-
136
 |
 |
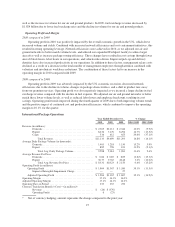
Volume
2010 compared to 2009
Export volume increased for 2010, as the worldwide economy and world trade continued to improve. We
experienced strong growth in Asia, where volume grew 28% due to a combination of regional economic growth
and geographic expansion of our service offerings. European export volume also had strong growth for the year,
increasing 10% compared with the prior year, due to market share gains, economic growth in certain key
markets, and an overall expansion of trade in the European Union. U.S. origin export volume also had solid
growth during the year. Our premium Worldwide Express and Expedited products grew at a relatively faster rate
than our standard transborder and trade direct products.
Non-U.S. domestic volume increased 15.2% for the year, due in part to the acquisition of Unsped Paket
Servisi San ve Ticaret A.S. (“Unsped”) in Turkey in the third quarter of 2009. Excluding the acquisition of
Unsped, non-U.S. domestic volume increased 9.7%, led by the strength in core European markets, Canada and
Mexico.
2009 compared to 2008
Export volume declined, primarily due to weakness in the Asia, Europe and U.S. export lanes, as the
worldwide economic recession and slowdown in world trade more than offset market share gains. Transborder
export volume was relatively stronger within the European Union and North America trade areas, while volume
in the longer export trade lanes was comparatively weaker. Non-U.S. domestic volume increased for the year,
largely due to the acquisition of Unsped, as well as volume growth in Germany, France, Poland and Canada.
By the fourth quarter of 2009, export volume began to improve as global trade and economic activity
accelerated. The Asia and U.S. export lanes demonstrated significant improvement, as those trade areas suffered
a relatively greater decline in the early part of the year. Domestic volume continued to benefit from the Unsped
acquisition, as well as market share gains and general economic improvement in Europe and the Americas.
Volume was relatively stronger in the small and middle market customer segments.
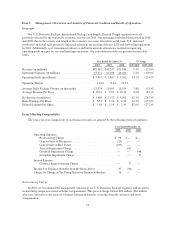
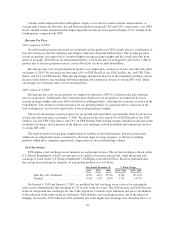
Revenue Per Piece
2010 compared to 2009
Export revenue per piece increased during 2010, largely due to higher fuel surcharge rates, base rate
increases and product mix. Export revenue per piece increased as higher-yielding products (such as Worldwide
Express and Worldwide Expedited) grew at a relatively faster pace. In 2010, we experienced an overall
lengthening of trade lanes, as inter-regional trade increased (especially in our Asia-to-Europe and Asia-to-U.S.
export lanes), leading to relatively stronger growth for our premium products. The impact of currency, net of
hedging, resulted in a decrease to revenue growth during the year. Domestic revenue per piece decreased,
primarily due to the impact of lower-yielding domestic packages from the Unsped acquisition. Total average
revenue per piece increased 0.7% for the year on a currency-adjusted basis.
On January 4, 2010, we increased the base rates 6.9% for international shipments originating in the United
States (Worldwide Express, Worldwide Express Plus, UPS Worldwide Expedited and UPS International
Standard service). Rate changes for shipments originating outside the U.S. were made throughout the year and
varied by geographic market.
2009 compared to 2008
Export revenue per piece decreased, largely due to the adverse impact of currency exchange rates, lower
fuel surcharge rates, and product mix, but was partially offset by base rate increases that took effect in the first
28