UPS 2010 Annual Report Download - page 77
Download and view the complete annual report
Please find page 77 of the 2010 UPS annual report below. You can navigate through the pages in the report by either clicking on the pages listed below, or by using the keyword search tool below to find specific information within the annual report.-
 1
1 -
2
-
3
-
4
-
5
-
6
-
7
-
8
-
9
-
10
-
11
-
12
-
13
-
14
-
15
-
16
-
17
-
18
-
19
-
20
-
21
-
22
-
23
-
24
-
25
-
26
-
27
-
28
-
29
-
30
-
31
-
32
-
33
-
34
-
35
-
36
-
37
-
38
-
39
-
40
-
41
-
42
-
43
-
44
-
45
-
46
-
47
-
48
-
49
-
50
-
51
-
52
-
53
-
54
-
55
-
56
-
57
-
58
-
59
-
60
-
61
-
62
-
63
-
64
-
65
-
66
-
 67
67 -
 68
68 -
 69
69 -
 70
70 -
 71
71 -
 72
72 -
 73
73 -
 74
74 -
 75
75 -
 76
76 -
 77
77 -
 78
78 -
 79
79 -
 80
80 -
 81
81 -
 82
82 -
 83
83 -
 84
84 -
 85
85 -
 86
86 -
 87
87 -
88
-
89
-
90
-
91
-
92
-
93
-
94
-
95
-
96
-
97
-
98
-
99
-
100
-
101
-
102
-
103
-
104
-
105
-
106
-
107
-
108
-
109
-
110
-
111
-
112
-
113
-
114
-
115
-
116
-
117
-
118
-
119
-
120
-
121
-
122
-
123
-
124
-
125
-
126
-
127
-
128
-
129
-
130
-
131
-
132
-
133
-
134
-
135
-
136
 |
 |

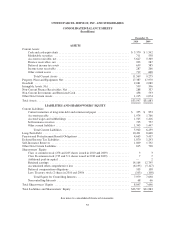
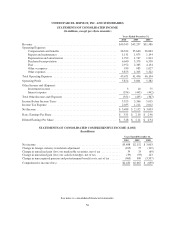
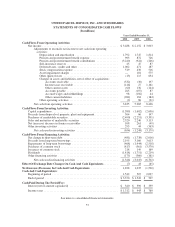
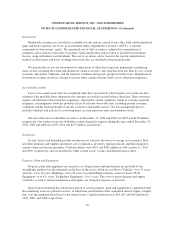
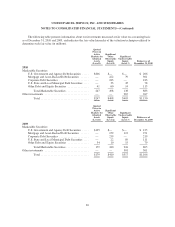
UNITED PARCEL SERVICE, INC. AND SUBSIDIARIES
NOTES TO CONSOLIDATED FINANCIAL STATEMENTS—(Continued)
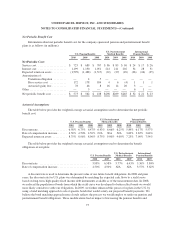
Cost
Unrealized
Gains
Unrealized
Losses
Estimated
Fair Value
2009
Current marketable securities:
U.S. government and agency debt securities ................. $126 $— $ (1) $125
Mortgage and asset-backed debt securities .................. 158 2 (1) 159
Corporate debt securities ................................ 213 6 — 219
U.S. state and local municipal debt securities ................ 22 — — 22
Other debt and equity securities ........................... 28 5 — 33
Current marketable securities ................................ 547 13 (2) 558
Non-current marketable securities:
Mortgage and asset-backed debt securities .................. 150 — (38) 112
U.S. state and local municipal debt securities ................ 115 — (26) 89
Common equity securities ............................... 21 10 — 31
Preferred equity securities ............................... 16 — (1) 15
Non-current marketable securities ............................. 302 10 (65) 247
Total marketable securities .................................. $849 $ 23 $ (67) $805
The gross realized gains on sales of marketable securities totaled $24, $16 and $19 million in 2010, 2009,
and 2008, respectively. The gross realized losses totaled $18, $12 and $10 million in 2010, 2009 and 2008,
respectively. Impairment losses recognized on marketable securities and short-term investments totaled $21, $17
and $23 million during 2010, 2009 and 2008 (discussed further below), respectively.
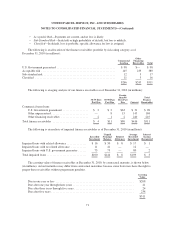
Auction Rate Securities
At December 31, 2010, we held $144 million in principal value of investments in auction rate securities.
Some of these investments take the form of debt securities, and are structured as direct obligations of local
governments or agencies (classified as “U.S. state and local municipal debt securities”). Other auction rate
security investments are structured as obligations of asset-backed trusts (classified as “Mortgage and asset-
backed debt securities”), generally all of which are collateralized by student loans and are guaranteed by the U.S.
Government or through private insurance. The remaining auction rate securities take the form of preferred stock,
and are collateralized by securities issued directly by large corporations or money market securities. Substantially
all of our investments in auction rate securities maintain investment-grade ratings of BBB / Baa or higher by
Standard & Poor’s Rating Service (“Standard & Poor’s”) and Moody’s Investors Service (“Moody’s”),
respectively.
During the first quarter of 2008, market auctions, including auctions for substantially all of our auction rate
securities portfolio, began to fail due to insufficient buyers. As a result of the persistent failed auctions, and the
uncertainty of when these investments could successfully be liquidated at par, we reclassified all of our
investments in auction rate securities to non-current marketable securities, as noted in the table above, as of
March 31, 2008. As market auctions have continued to fail, we have retained the non-current classification of
these securities as of December 31, 2010. The securities for which auctions have failed will continue to accrue
interest and be auctioned at each respective reset date until the auction succeeds, the issuer redeems the
securities, or the securities mature. During 2010, auction rate securities with a par value of $44 million were
successfully auctioned, resulting in their liquidation with no realized gain or loss.
65