UPS 2010 Annual Report Download - page 82
Download and view the complete annual report
Please find page 82 of the 2010 UPS annual report below. You can navigate through the pages in the report by either clicking on the pages listed below, or by using the keyword search tool below to find specific information within the annual report.-
 1
1 -
2
-
3
-
4
-
5
-
6
-
7
-
8
-
9
-
10
-
11
-
12
-
13
-
14
-
15
-
16
-
17
-
18
-
19
-
20
-
21
-
22
-
23
-
24
-
25
-
26
-
27
-
28
-
29
-
30
-
31
-
32
-
33
-
34
-
35
-
36
-
37
-
38
-
39
-
40
-
41
-
42
-
43
-
44
-
45
-
46
-
47
-
48
-
49
-
50
-
51
-
52
-
53
-
54
-
55
-
56
-
57
-
58
-
59
-
60
-
61
-
62
-
63
-
64
-
65
-
66
-
67
-
68
-
69
-
70
-
71
-
 72
72 -
 73
73 -
 74
74 -
 75
75 -
 76
76 -
 77
77 -
 78
78 -
 79
79 -
 80
80 -
 81
81 -
 82
82 -
 83
83 -
 84
84 -
 85
85 -
 86
86 -
 87
87 -
 88
88 -
 89
89 -
 90
90 -
 91
91 -
 92
92 -
93
-
94
-
95
-
96
-
97
-
98
-
99
-
100
-
101
-
102
-
103
-
104
-
105
-
106
-
107
-
108
-
109
-
110
-
111
-
112
-
113
-
114
-
115
-
116
-
117
-
118
-
119
-
120
-
121
-
122
-
123
-
124
-
125
-
126
-
127
-
128
-
129
-
130
-
131
-
132
-
133
-
134
-
135
-
136
 |
 |

UNITED PARCEL SERVICE, INC. AND SUBSIDIARIES
NOTES TO CONSOLIDATED FINANCIAL STATEMENTS—(Continued)
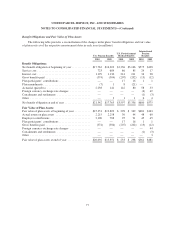
The following table presents the changes in the above Level 3 instruments measured on a recurring basis for
the year ended December 31, 2010 (in millions).
Marketable
Securities
Other
Investments Total
Balance on January 1, 2010 .......................................... $216 $301 $ 517
Transfers into (out of) Level 3 ....................................... — — —
Net realized and unrealized gains (losses):
Included in earnings (in investment income) ........................ (27) (34) (61)
Included in accumulated other comprehensive income (pre-tax) ......... 59 — 59
Purchases ........................................................ — — —
Settlements ...................................................... (110) — (110)
Balance on December 31, 2010 ....................................... $138 $267 $ 405
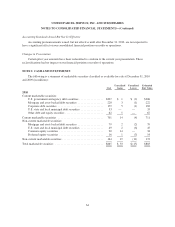
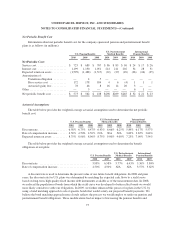
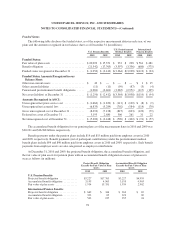
NOTE 3. FINANCE RECEIVABLES
The following is a summary of finance receivables at December 31, 2010 and 2009 (in millions):
2010 2009
Commercial term loans .................................................. $266 $305
Other financing receivables ............................................... 245 350
Gross finance receivables ................................................ 511 655
Less: Allowance for credit losses .......................................... (20) (31)
Balance at December 31 ................................................. $491 $624
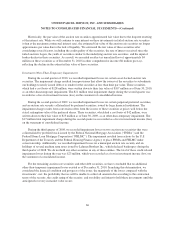
Our finance receivables portfolio consists of two product groups: commercial term loans and other financing
receivables. Other financing receivables consist of investments in finance leases, asset-based lending, and
receivable factoring. Outstanding receivable balances at December 31, 2010 and 2009 are net of unearned
income of $15 and $19 million, respectively. When we “factor” (i.e., purchase) a customer invoice from a client,
we record the customer receivable as an asset and also establish a liability for the funds due to the client, which is
recorded in accounts payable on the consolidated balance sheet. As of December 31, 2010 and 2009, the amounts
due to clients under our factoring programs were $71 and $88 million, respectively.
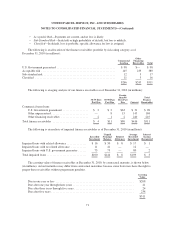
The following is a rollforward of the allowance for credit losses on finance receivables (in millions):
2010 2009
Balance at January 1 ..................................................... $31 $25
Provisions charged to operations ........................................... 10 25
Charge-offs, net of recoveries ............................................. (21) (19)
Balance at December 31 .................................................. $20 $31
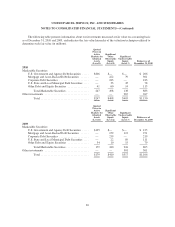
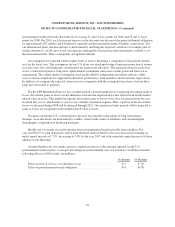
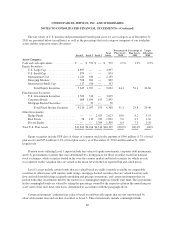
We use a multiple tier risk assessment matrix to grade and monitor asset quality. The primary assessments
are made to determine the degree of risk that an obligor may default in principal or interest payments and the
potential range of loss in the event of default. The risk assessment categories are:
•U.S. Government Guaranteed—Payments are guaranteed by the Small Business Administration or U.S.
Department of Agriculture, and no loss is likely.
70