UPS 2010 Annual Report Download - page 79
Download and view the complete annual report
Please find page 79 of the 2010 UPS annual report below. You can navigate through the pages in the report by either clicking on the pages listed below, or by using the keyword search tool below to find specific information within the annual report.-
 1
1 -
2
-
3
-
4
-
5
-
6
-
7
-
8
-
9
-
10
-
11
-
12
-
13
-
14
-
15
-
16
-
17
-
18
-
19
-
20
-
21
-
22
-
23
-
24
-
25
-
26
-
27
-
28
-
29
-
30
-
31
-
32
-
33
-
34
-
35
-
36
-
37
-
38
-
39
-
40
-
41
-
42
-
43
-
44
-
45
-
46
-
47
-
48
-
49
-
50
-
51
-
52
-
53
-
54
-
55
-
56
-
57
-
58
-
59
-
60
-
61
-
62
-
63
-
64
-
65
-
66
-
67
-
68
-
 69
69 -
 70
70 -
 71
71 -
 72
72 -
 73
73 -
 74
74 -
 75
75 -
 76
76 -
 77
77 -
 78
78 -
 79
79 -
 80
80 -
 81
81 -
 82
82 -
 83
83 -
 84
84 -
 85
85 -
 86
86 -
 87
87 -
 88
88 -
 89
89 -
90
-
91
-
92
-
93
-
94
-
95
-
96
-
97
-
98
-
99
-
100
-
101
-
102
-
103
-
104
-
105
-
106
-
107
-
108
-
109
-
110
-
111
-
112
-
113
-
114
-
115
-
116
-
117
-
118
-
119
-
120
-
121
-
122
-
123
-
124
-
125
-
126
-
127
-
128
-
129
-
130
-
131
-
132
-
133
-
134
-
135
-
136
 |
 |

UNITED PARCEL SERVICE, INC. AND SUBSIDIARIES
NOTES TO CONSOLIDATED FINANCIAL STATEMENTS—(Continued)
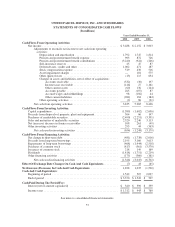
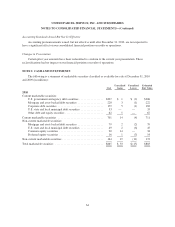
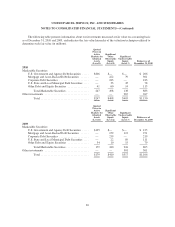
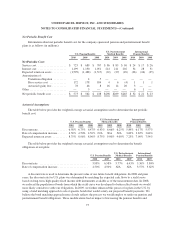
Unrealized Losses
The following table presents the age of gross unrealized losses and fair value by investment category for all
securities in a loss position as of December 31, 2010 (in millions):
Less Than 12 Months 12 Months or More Total
Fair
Value
Unrealized
Losses
Fair
Value
Unrealized
Losses
Fair
Value
Unrealized
Losses
U.S. government and agency debt securities ....... $ 75 $ (2) $— $— $ 75 $ (2)
Mortgage and asset-backed debt securities ........ 93 (1) 28 (2) 121 (3)
Corporate debt securities ...................... 65 (1) — — 65 (1)
U.S. state and local municipal debt securities ...... — — 21 (6) 21 (6)
Other debt securities .......................... 3 — — — 3 —
Total debt securities ...................... 236 (4) 49 (8) 285 (12)
Common equity securities ..................... — — ————
Preferred equity securities ..................... — — 6 (3) 6 (3)
$236 $ (4) $ 55 $ (11) $291 $ (15)
The unrealized losses in the U.S. state and local municipal securities, preferred equity securities, and
mortgage and asset-backed securities primarily relate to the auction rate securities discussed previously. The
unrealized losses for the non-auction rate securities within those categories are primarily related to various fixed
income securities, and are primarily due to changes in market interest rates. We have both the intent and ability
to hold the securities contained in the previous table for a time necessary to recover the cost basis.
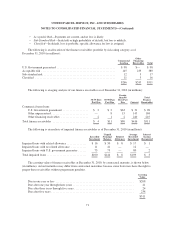
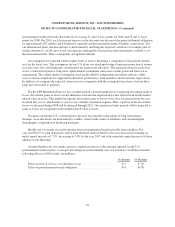
Maturity Information
The amortized cost and estimated fair value of marketable securities at December 31, 2010, by contractual
maturity, are shown below (in millions). Actual maturities may differ from contractual maturities because the
issuers of the securities may have the right to prepay obligations without prepayment penalties.
Cost
Estimated
Fair Value
Due in one year or less ............................................... $102 $102
Due after one year through three years .................................. 213 215
Due after three years through five years ................................. 52 52
Due after five years ................................................. 443 441
810 810
Equity securities .................................................... 55 73
$865 $883
Restricted Cash
Restricted cash and cash equivalents relate to our self-insurance requirements. In 2008, we entered into an
escrow agreement with an insurance carrier to guarantee our self-insurance obligations. This agreement requires
us to provide cash collateral to the insurance carrier, which is classified as other non-current assets on our
consolidated balance sheets. Additional cash collateral provided is reflected in other investing activities in the
statements of consolidated cash flows. This restricted cash is invested in money market funds and similar cash
equivalent type assets. As of December 31, 2010 and 2009, we had $286 million in restricted cash.
67