U-Haul 2016 Annual Report Download - page 98
Download and view the complete annual report
Please find page 98 of the 2016 U-Haul annual report below. You can navigate through the pages in the report by either clicking on the pages listed below, or by using the keyword search tool below to find specific information within the annual report.-
 1
1 -
2
-
3
-
4
-
5
-
6
-
7
-
8
-
9
-
10
-
11
-
12
-
13
-
14
-
15
-
16
-
17
-
18
-
19
-
20
-
21
-
22
-
23
-
24
-
25
-
26
-
27
-
28
-
29
-
30
-
31
-
32
-
33
-
34
-
35
-
36
-
37
-
38
-
39
-
40
-
41
-
42
-
43
-
44
-
45
-
46
-
47
-
48
-
49
-
50
-
51
-
52
-
53
-
54
-
55
-
56
-
57
-
58
-
59
-
60
-
61
-
62
-
63
-
64
-
65
-
66
-
67
-
68
-
69
-
70
-
71
-
72
-
73
-
74
-
75
-
76
-
77
-
78
-
79
-
80
-
81
-
82
-
83
-
84
-
85
-
86
-
87
-
 88
88 -
 89
89 -
 90
90 -
 91
91 -
 92
92 -
 93
93 -
 94
94 -
 95
95 -
 96
96 -
 97
97 -
 98
98 -
 99
99 -
 100
100 -
 101
101 -
 102
102 -
 103
103 -
 104
104 -
 105
105 -
 106
106 -
 107
107 -
 108
108 -
109
-
110
-
111
-
112
-
113
-
114
-
115
-
116
-
117
-
118
-
119
-
120
-
121
-
122
-
123
-
124
-
125
-
126
-
127
-
128
-
129
-
130
 |
 |

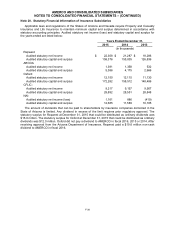
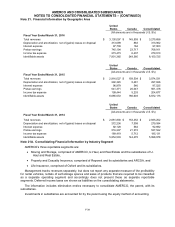
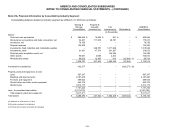
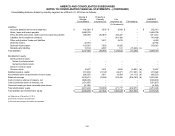
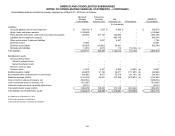
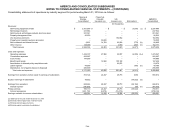
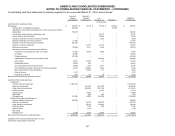
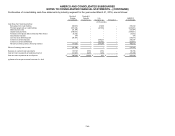
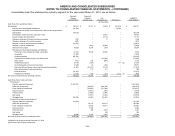
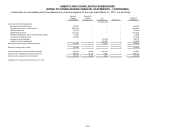
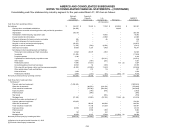
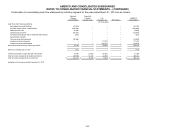
AMERCO AND CONSOLIDATED SUBSIDIARIES
NOTES TO CONSOLIDATED FINANCIAL STATEMENTS – (CONTINUED)
F-42
Consolidating balance sheets by industry segment as of March 31, 2015 are as follows:
Moving &
Storage
Consolidated
Property &
Casualty
Insurance (a)
Life
Insurance (a)
Eliminations
AMERCO
Consolidated
(In thousands)
Assets:
Cash and cash equivalents
$
431,873
$
8,495
$
1,482
$
–
$
441,850
Reinsurance recoverables and trade receivables, net
32,364
125,506
31,999
–
189,869
Inventories, net
69,472
–
–
–
69,472
Prepaid expenses
126,296
–
–
–
126,296
Investments, fixed maturities and marketable equities
–
228,530
1,076,432
–
1,304,962
Investments, other
27,637
50,867
190,216
–
268,720
Deferred policy acquisition costs, net
–
–
115,422
–
115,422
Other assets
101,689
1,924
2,544
–
106,157
Related party assets
144,040
13,268
586
(16,104)
(c)
141,790
933,371
428,590
1,418,681
(16,104)
2,764,538
Investment in subsidiaries
443,462
–
–
(443,462)
(b)
–
Property, plant and equipment, at cost:
Land
467,482
–
–
–
467,482
Buildings and improvements
1,728,033
–
–
–
1,728,033
Furniture and equipment
355,349
–
–
–
355,349
Rental trailers and other rental equipment
436,642
–
–
–
436,642
Rental trucks
3,059,987
–
–
–
3,059,987
6,047,493
–
–
–
6,047,493
Less: Accumulated depreciation
(1,939,856)
–
–
–
(1,939,856)
Total property, plant and equipment
4,107,637
–
–
–
4,107,637
Total assets
$
5,484,470
$
428,590
$
1,418,681
$
(459,566)
$
6,872,175
(a) Balances as of December 31, 2014
(b) Eliminate investment in subsidiaries
(c) Eliminate intercompany receivables and payables