U-Haul 2016 Annual Report Download - page 34
Download and view the complete annual report
Please find page 34 of the 2016 U-Haul annual report below. You can navigate through the pages in the report by either clicking on the pages listed below, or by using the keyword search tool below to find specific information within the annual report.-
 1
1 -
2
-
3
-
4
-
5
-
6
-
7
-
8
-
9
-
10
-
11
-
12
-
13
-
14
-
15
-
16
-
17
-
18
-
19
-
20
-
21
-
22
-
23
-
 24
24 -
 25
25 -
 26
26 -
 27
27 -
 28
28 -
 29
29 -
 30
30 -
 31
31 -
 32
32 -
 33
33 -
 34
34 -
 35
35 -
 36
36 -
 37
37 -
 38
38 -
 39
39 -
 40
40 -
 41
41 -
 42
42 -
 43
43 -
 44
44 -
45
-
46
-
47
-
48
-
49
-
50
-
51
-
52
-
53
-
54
-
55
-
56
-
57
-
58
-
59
-
60
-
61
-
62
-
63
-
64
-
65
-
66
-
67
-
68
-
69
-
70
-
71
-
72
-
73
-
74
-
75
-
76
-
77
-
78
-
79
-
80
-
81
-
82
-
83
-
84
-
85
-
86
-
87
-
88
-
89
-
90
-
91
-
92
-
93
-
94
-
95
-
96
-
97
-
98
-
99
-
100
-
101
-
102
-
103
-
104
-
105
-
106
-
107
-
108
-
109
-
110
-
111
-
112
-
113
-
114
-
115
-
116
-
117
-
118
-
119
-
120
-
121
-
122
-
123
-
124
-
125
-
126
-
127
-
128
-
129
-
130
 |
 |

28
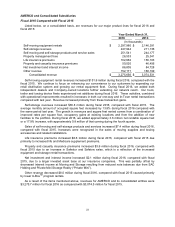
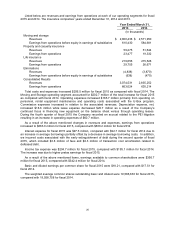
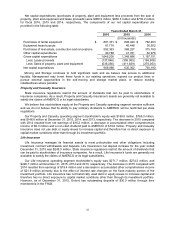
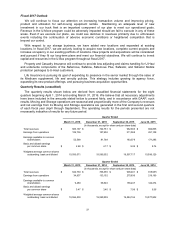
Total costs and expenses decreased $18.6 million for fiscal 2016 as compared with fiscal 2015. The
largest component of the decrease was related to our accruals for expenses associated with the PEI
litigation which were $5.0 million and $60.7 million for fiscal 2016 and 2015, respectively. Personnel and
overhead cost increases were partially offset by decreased direct operating costs associated with the U-
Box program. Depreciation expense increased $36.6 million; however, gains from the disposal of
property, plant and equipment increased $24.1 million. This resulted in a net increase of $12.5 million in
depreciation expense, net. We have increased the number of trucks sold compared with the same period
last year and the resale market for these trucks remained relatively strong. Lease expense decreased
$30.0 million as a result of our shift in financing new equipment on the balance sheet versus through
operating leases.
As a result of the above mentioned changes in revenues and expenses, earnings from operations for
Moving and Storage before consolidation of the equity in the earnings of the insurance subsidiaries
increased to $813.1 million for fiscal 2016 as compared with $610.4 million for fiscal 2015.
Equity in the earnings of AMERCO’s insurance subsidiaries increased $0.7 million for fiscal 2016,
compared with fiscal 2015.
As a result of the above mentioned changes in revenues and expenses, earnings from operations
increased to $848.6 million for fiscal 2016, compared with $645.2 million for fiscal 2015.
Fiscal 2015 Compared with Fiscal 2014
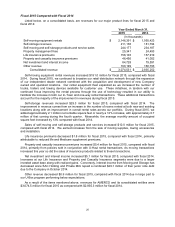
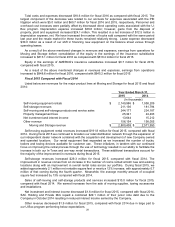
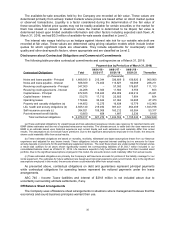
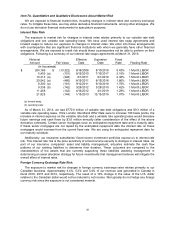
Listed below are revenues for the major product lines at Moving and Storage for fiscal 2015 and fiscal
2014:
Year Ended March 31,
2015
2014
(In thousands)
Self-moving equipment rentals
$
2,149,986
$
1,958,209
Self-storage revenues
211,136
181,794
Self-moving and self-storage products and service sales
244,177
234,187
Property management fees
25,341
24,493
Net investment and interest income
13,644
15,212
Other revenue
156,154
158,055
Moving and Storage revenue
$
2,800,438
$
2,571,950
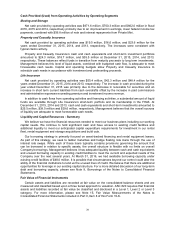
Self-moving equipment rental revenues increased $191.8 million for fiscal 2015, compared with fiscal
2014. During fiscal 2015 we continued to broaden our retail distribution network through the expansion of
our independent dealer network combined with the acquisition and development of new Company owned
and operated locations. Our rental equipment fleet expanded as we increased the number of trucks,
trailers and towing devices available for customer use. These initiatives, in tandem with our continued
focus on improving the rental process through the use of technology resulted in our ability to facilitate the
increase in both our In-Town and one-way rental transactions. These additional transactions account for
the majority of the improvement in revenues during fiscal 2015.
Self-storage revenues increased $29.3 million for fiscal 2015, compared with fiscal 2014. The
improvement in revenue comes from an increase in the number of rooms rented at both new and existing
locations along with an improvement in overall rental rates across our portfolio. During fiscal 2015, we
added approximately 2.1 million net rentable square feet or nearly a 12% increase, with approximately 0.7
million of that coming during the fourth quarter. Meanwhile, the average monthly amount of occupied
square feet increased by 13% compared with fiscal 2014.
Sales of self-moving and self-storage products and services increased $10.0 million for fiscal 2015,
compared with fiscal 2014. We earned increases from the sale of moving supplies, towing accessories
and installations.
Net investment and interest income decreased $1.6 million for fiscal 2015, compared with fiscal 2014.
SAC Holding and Private Mini repaid a combined $29.1 million of their junior note debt due to the
Company in October 2014 resulting in reduced interest income earned by the Company.
Other revenue decreased $1.9 million for fiscal 2015, compared with fiscal 2014 due in large part to
our U-Box program performing below expectations.