U-Haul 2016 Annual Report Download - page 97
Download and view the complete annual report
Please find page 97 of the 2016 U-Haul annual report below. You can navigate through the pages in the report by either clicking on the pages listed below, or by using the keyword search tool below to find specific information within the annual report.-
 1
1 -
2
-
3
-
4
-
5
-
6
-
7
-
8
-
9
-
10
-
11
-
12
-
13
-
14
-
15
-
16
-
17
-
18
-
19
-
20
-
21
-
22
-
23
-
24
-
25
-
26
-
27
-
28
-
29
-
30
-
31
-
32
-
33
-
34
-
35
-
36
-
37
-
38
-
39
-
40
-
41
-
42
-
43
-
44
-
45
-
46
-
47
-
48
-
49
-
50
-
51
-
52
-
53
-
54
-
55
-
56
-
57
-
58
-
59
-
60
-
61
-
62
-
63
-
64
-
65
-
66
-
67
-
68
-
69
-
70
-
71
-
72
-
73
-
74
-
75
-
76
-
77
-
78
-
79
-
80
-
81
-
82
-
83
-
84
-
85
-
86
-
 87
87 -
 88
88 -
 89
89 -
 90
90 -
 91
91 -
 92
92 -
 93
93 -
 94
94 -
 95
95 -
 96
96 -
 97
97 -
 98
98 -
 99
99 -
 100
100 -
 101
101 -
 102
102 -
 103
103 -
 104
104 -
 105
105 -
 106
106 -
 107
107 -
108
-
109
-
110
-
111
-
112
-
113
-
114
-
115
-
116
-
117
-
118
-
119
-
120
-
121
-
122
-
123
-
124
-
125
-
126
-
127
-
128
-
129
-
130
 |
 |

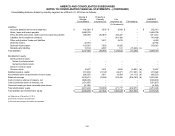
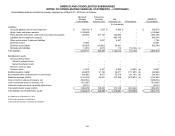
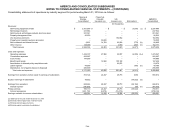
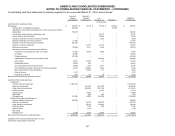
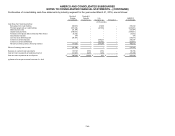
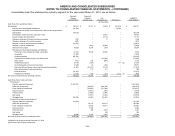
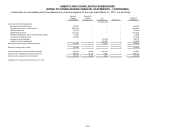
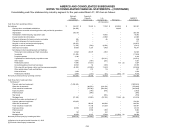
AMERCO AND CONSOLIDATED SUBSIDIARIES
NOTES TO CONSOLIDATED FINANCIAL STATEMENTS – (CONTINUED)
F-41
Consolidating balance sheets by industry segment as of March 31, 2016 are as follows:
Moving &
Storage
Consolidated
Property &
Casualty
Insurance (a)
Life
Insurance (a)
Eliminations
AMERCO
Consolidated
(In thousands)
Liabilities:
Accounts payable and accrued expenses
$
492,982
$
1,535
$
8,096
$
–
$
502,613
Notes, loans and leases payable
2,688,758
–
–
–
2,688,758
Policy benefits and losses, claims and loss expenses payable
386,366
252,819
432,227
–
1,071,412
Liabilities from investment contracts
–
–
951,490
–
951,490
Other policyholders' funds and liabilities
–
3,017
5,633
–
8,650
Deferred income
22,784
–
–
–
22,784
Deferred income taxes
633,061
7,526
13,025
–
653,612
Related party liabilities
13,138
2,067
161
(15,366)
(c)
–
Total liabilities
4,237,089
266,964
1,410,632
(15,366)
5,899,319
Stockholders' equity :
Series preferred stock:
Series A preferred stock
–
–
–
–
–
Series B preferred stock
–
–
–
–
–
Series A common stock
–
–
–
–
–
Common stock
10,497
3,301
2,500
(5,801)
(b)
10,497
Additional paid-in capital
451,839
91,120
26,271
(117,601)
(b)
451,629
Accumulated other comprehensive income (loss)
(60,525)
3,611
10,504
(14,115)
(b)
(60,525)
Retained earnings
2,533,431
62,528
232,442
(294,760)
(b)
2,533,641
Cost of common shares in treasury, net
(525,653)
–
–
–
(525,653)
Cost of preferred shares in treasury, net
(151,997)
–
–
–
(151,997)
Unearned employee stock ownership plan shares
(6,186)
–
–
–
(6,186)
Total stockholders' equity
2,251,406
160,560
271,717
(432,277)
2,251,406
Total liabilities and stockholders' equity
$
6,488,495
$
427,524
$
1,682,349
$
(447,643)
$
8,150,725
(a) Balances as of December 31, 2015
(b) Eliminate investment in subsidiaries
(c) Eliminate intercompany receivables and payables