U-Haul 2016 Annual Report Download - page 85
Download and view the complete annual report
Please find page 85 of the 2016 U-Haul annual report below. You can navigate through the pages in the report by either clicking on the pages listed below, or by using the keyword search tool below to find specific information within the annual report.-
 1
1 -
2
-
3
-
4
-
5
-
6
-
7
-
8
-
9
-
10
-
11
-
12
-
13
-
14
-
15
-
16
-
17
-
18
-
19
-
20
-
21
-
22
-
23
-
24
-
25
-
26
-
27
-
28
-
29
-
30
-
31
-
32
-
33
-
34
-
35
-
36
-
37
-
38
-
39
-
40
-
41
-
42
-
43
-
44
-
45
-
46
-
47
-
48
-
49
-
50
-
51
-
52
-
53
-
54
-
55
-
56
-
57
-
58
-
59
-
60
-
61
-
62
-
63
-
64
-
65
-
66
-
67
-
68
-
69
-
70
-
71
-
72
-
73
-
74
-
 75
75 -
 76
76 -
 77
77 -
 78
78 -
 79
79 -
 80
80 -
 81
81 -
 82
82 -
 83
83 -
 84
84 -
 85
85 -
 86
86 -
 87
87 -
 88
88 -
 89
89 -
 90
90 -
 91
91 -
 92
92 -
 93
93 -
 94
94 -
 95
95 -
96
-
97
-
98
-
99
-
100
-
101
-
102
-
103
-
104
-
105
-
106
-
107
-
108
-
109
-
110
-
111
-
112
-
113
-
114
-
115
-
116
-
117
-
118
-
119
-
120
-
121
-
122
-
123
-
124
-
125
-
126
-
127
-
128
-
129
-
130
 |
 |

AMERCO AND CONSOLIDATED SUBSIDIARIES
NOTES TO CONSOLIDATED FINANCIAL STATEMENTS – (CONTINUED)
F-29
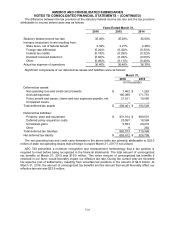
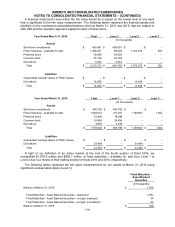
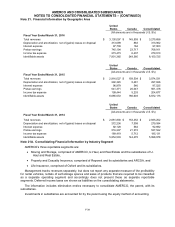
A financial instrument’s level within the fair value hierarchy is based on the lowest level of any input
that is significant to the fair value measurement. The following tables represent the financial assets and
liabilities on the condensed consolidated balance sheet at March 31, 2016 and 2015, that are subject to
ASC 820 and the valuation approach applied to each of these items.
Year Ended March 31, 2016
Total
Level 1
Level 2
Level 3
(In thousands)
Assets
Short-term investments
$
499,491
$
499,491
$
–
$
–
Fixed maturities - available for sale
1,466,941
96,328
1,370,275
338
Preferred stock
18,428
18,428
–
–
Common stock
25,169
25,169
–
–
Derivatives
3,344
3,344
–
–
Total
$
2,013,373
$
642,760
$
1,370,275
$
338
Liabilities
Guaranteed residual values of TRAC leases
$
–
$
–
$
–
$
–
Derivatives
14,845
–
14,845
–
Total
$
14,845
$
–
$
14,845
$
–
Year Ended March 31, 2015
Total
Level 1
Level 2
Level 3
(In thousands)
Assets
Short-term investments
$
460,762
$
460,762
$
–
$
–
Fixed maturities - available for sale
1,262,012
101,201
1,159,807
1,004
Preferred stock
18,296
18,296
–
–
Common stock
24,654
24,654
–
–
Derivatives
4,876
4,876
–
–
Total
$
1,770,600
$
609,789
$
1,159,807
$
1,004
Liabilities
Guaranteed residual values of TRAC leases
$
–
$
–
$
–
$
–
Derivatives
24,484
–
24,484
–
Total
$
24,484
$
–
$
24,484
$
–
In light of our definition of an active market at the end of the fourth quarter of fiscal 2016, we
reclassified $1,079.0 million and $895.7 million of fixed maturities – available for sale from Level 1 to
Level 2 due to a review of their trading activity for fiscal 2016 and 2015, respectively.
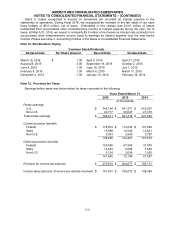
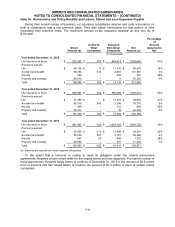
The following tables represent the fair value measurements for our assets at March 31, 2016 using
significant unobservable inputs (Level 3).
Fixed Maturities -
Asset Backed
Securities
(In thousands)
Balance at March 31, 2015
$
1,004
Fixed Maturities - Asset Backed Securities - redeemed
(753)
Fixed Maturities - Asset Backed Securities - net gain (realized)
34
Fixed Maturities - Asset Backed Securities - net gain (unrealized)
53
Balance at March 31, 2016
$
338