U-Haul 2016 Annual Report Download - page 103
Download and view the complete annual report
Please find page 103 of the 2016 U-Haul annual report below. You can navigate through the pages in the report by either clicking on the pages listed below, or by using the keyword search tool below to find specific information within the annual report.-
 1
1 -
2
-
3
-
4
-
5
-
6
-
7
-
8
-
9
-
10
-
11
-
12
-
13
-
14
-
15
-
16
-
17
-
18
-
19
-
20
-
21
-
22
-
23
-
24
-
25
-
26
-
27
-
28
-
29
-
30
-
31
-
32
-
33
-
34
-
35
-
36
-
37
-
38
-
39
-
40
-
41
-
42
-
43
-
44
-
45
-
46
-
47
-
48
-
49
-
50
-
51
-
52
-
53
-
54
-
55
-
56
-
57
-
58
-
59
-
60
-
61
-
62
-
63
-
64
-
65
-
66
-
67
-
68
-
69
-
70
-
71
-
72
-
73
-
74
-
75
-
76
-
77
-
78
-
79
-
80
-
81
-
82
-
83
-
84
-
85
-
86
-
87
-
88
-
89
-
90
-
91
-
92
-
 93
93 -
 94
94 -
 95
95 -
 96
96 -
 97
97 -
 98
98 -
 99
99 -
 100
100 -
 101
101 -
 102
102 -
 103
103 -
 104
104 -
 105
105 -
 106
106 -
 107
107 -
 108
108 -
 109
109 -
 110
110 -
 111
111 -
 112
112 -
 113
113 -
114
-
115
-
116
-
117
-
118
-
119
-
120
-
121
-
122
-
123
-
124
-
125
-
126
-
127
-
128
-
129
-
130
 |
 |

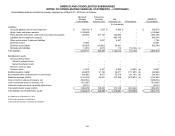
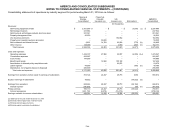
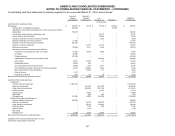
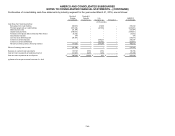
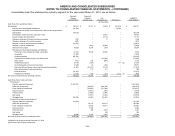
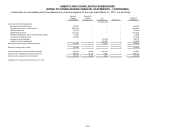
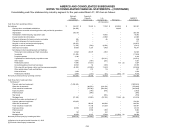
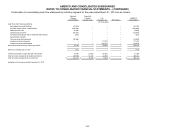
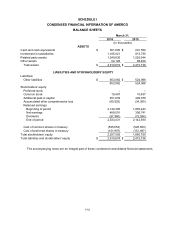
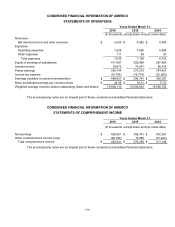
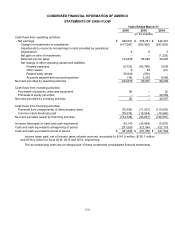
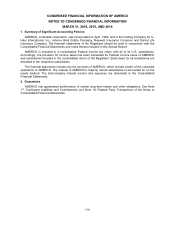
AMERCO AND CONSOLIDATED SUBSIDIARIES
NOTES TO CONSOLIDATED FINANCIAL STATEMENTS – (CONTINUED)
F-47
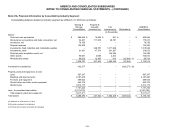
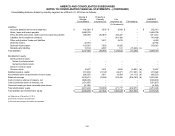
Consolidating cash flow statements by industry segment for the year ended March 31, 2016, are as follows:
Moving &
Storage
Consolidated
Property &
Casualty
Insurance (a)
Life
Insurance (a)
Elimination
AMERCO
Consolidated
(In thousands)
Cash flows from operating activities:
Net earnings
$
489,001
$
16,168
$
19,354
$
(35,522)
$
489,001
Earnings from consolidated subsidiaries
(35,522)
–
–
35,522
–
Adjustments to reconcile net earnings to the cash provided by operations:
Depreciation
389,393
–
–
–
389,393
Amortization of deferred policy acquisition costs
–
–
23,272
–
23,272
Interest credited to policyholders
–
–
20,465
–
20,465
Change in allowance for losses on trade receivables
7
–
(212)
–
(205)
Change in allowance for inventory reserve
(1,343)
–
–
–
(1,343)
Net gain on sale of real and personal property
(98,703)
–
–
–
(98,703)
Net gain on sale of investments
–
(1,317)
(3,174)
–
(4,491)
Deferred income taxes
124,838
9,311
3,926
–
138,075
Net change in other operating assets and liabilities:
Reinsurance recoverables and trade receivables
(2,169)
13,528
3,406
–
14,765
Inventories
(9,009)
–
–
–
(9,009)
Prepaid expenses
(10,338)
–
–
–
(10,338)
Capitalization of deferred policy acquisition costs
–
–
(32,590)
–
(32,590)
Other assets
16,231
(1,050)
141
–
15,322
Related party assets
55,962
682
–
–
56,644
Accounts payable and accrued expenses
26,093
1,533
9,761
–
37,387
Policy benefits and losses, claims and loss expenses payable
23,215
(18,925)
5,336
–
9,626
Other policyholders' funds and liabilities
–
(1,056)
707
–
(349)
Deferred income
4,757
–
–
–
4,757
Related party liabilities
(779)
115
48
–
(616)
Net cash provided (used) by operating activities
971,634
18,989
50,440
–
1,041,063
Cash flows from investing activities:
Purchases of:
Property, plant and equipment
(1,509,154)
–
–
–
(1,509,154)
Short term investments
–
(44,735)
(471,164)
–
(515,899)
Fixed maturities investments
–
(45,048)
(372,014)
–
(417,062)
Equity securities
–
–
(1,315)
–
(1,315)
Preferred stock
–
(1,005)
–
–
(1,005)
Real estate
–
(36)
(39)
–
(75)
Mortgage loans
(15,384)
(1,800)
(85,404)
–
(102,588)
Proceeds from sales and paydowns of:
Property, plant and equipment
539,256
–
–
–
539,256
Short term investments
–
44,756
483,424
–
528,180
Fixed maturities investments
–
26,193
128,343
–
154,536
Equity securities
–
1,236
808
–
2,044
Preferred stock
–
1,126
–
–
1,126
Real estate
–
–
–
–
–
Mortgage loans
21,589
5,878
21,090
–
48,557
Net cash provided (used) by investing activities
(963,693)
(13,435)
(296,271)
–
(1,273,399)
(a) Balance for the period ended December 31, 2015
(b) Eliminate intercompany investments