U-Haul 2016 Annual Report Download - page 100
Download and view the complete annual report
Please find page 100 of the 2016 U-Haul annual report below. You can navigate through the pages in the report by either clicking on the pages listed below, or by using the keyword search tool below to find specific information within the annual report.-
 1
1 -
2
-
3
-
4
-
5
-
6
-
7
-
8
-
9
-
10
-
11
-
12
-
13
-
14
-
15
-
16
-
17
-
18
-
19
-
20
-
21
-
22
-
23
-
24
-
25
-
26
-
27
-
28
-
29
-
30
-
31
-
32
-
33
-
34
-
35
-
36
-
37
-
38
-
39
-
40
-
41
-
42
-
43
-
44
-
45
-
46
-
47
-
48
-
49
-
50
-
51
-
52
-
53
-
54
-
55
-
56
-
57
-
58
-
59
-
60
-
61
-
62
-
63
-
64
-
65
-
66
-
67
-
68
-
69
-
70
-
71
-
72
-
73
-
74
-
75
-
76
-
77
-
78
-
79
-
80
-
81
-
82
-
83
-
84
-
85
-
86
-
87
-
88
-
89
-
 90
90 -
 91
91 -
 92
92 -
 93
93 -
 94
94 -
 95
95 -
 96
96 -
 97
97 -
 98
98 -
 99
99 -
 100
100 -
 101
101 -
 102
102 -
 103
103 -
 104
104 -
 105
105 -
 106
106 -
 107
107 -
 108
108 -
 109
109 -
 110
110 -
111
-
112
-
113
-
114
-
115
-
116
-
117
-
118
-
119
-
120
-
121
-
122
-
123
-
124
-
125
-
126
-
127
-
128
-
129
-
130
 |
 |

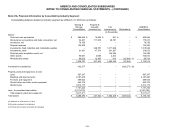
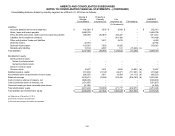
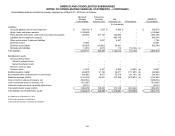
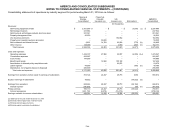
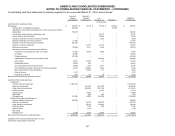
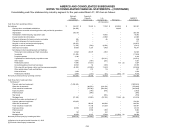
AMERCO AND CONSOLIDATED SUBSIDIARIES
NOTES TO CONSOLIDATED FINANCIAL STATEMENTS – (CONTINUED)
F-44
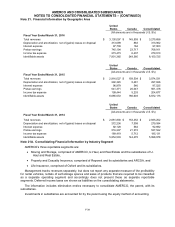
Consolidating statements of operations by industry segment for period ending March 31, 2016 are as follows:
Moving &
Storage
Consolidated
Property &
Casualty
Insurance (a)
Life
Insurance (a)
Eliminations
AMERCO
Consolidated
(In thousands)
Revenues:
Self-moving equipment rentals
$
2,301,586
$
–
$
–
$
(3,606)
(c)
$
2,297,980
Self-storage revenues
247,944
–
–
–
247,944
Self-moving & self-storage products & service sales
251,541
–
–
–
251,541
Property management fees
26,533
–
–
–
26,533
Life insurance premiums
–
–
162,662
–
162,662
Property and casualty insurance premiums
–
50,020
–
–
50,020
Net investment and interest income
8,801
14,783
63,999
(778)
(b)
86,805
Other revenue
148,099
–
4,559
(487)
(b)
152,171
Total revenues
2,984,504
64,803
231,220
(4,871)
3,275,656
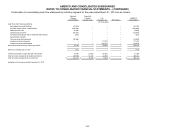
Costs and expenses:
Operating expenses
1,423,107
27,958
23,037
(4,055)
(b,c)
1,470,047
Commission expenses
262,627
–
–
–
262,627
Cost of sales
144,990
–
–
–
144,990
Benefits and losses
–
12,298
155,138
–
167,436
Amortization of deferred policy acquisition costs
–
–
23,272
–
23,272
Lease expense
49,966
–
–
(186)
(b)
49,780
Depreciation, net of (gains) losses on disposals
290,690
–
–
–
290,690
Total costs and expenses
2,171,380
40,256
201,447
(4,241)
2,408,842
Earnings from operations before equity in earnings of subsidiaries
813,124
24,547
29,773
(630)
866,814
Equity in earnings of subsidiaries
35,522
–
–
(35,522)
(d)
–
Earnings from operations
848,646
24,547
29,773
(36,152)
866,814
Interest expense
(98,533)
–
–
630
(b)
(97,903)
Pretax earnings
750,113
24,547
29,773
(35,522)
768,911
Income tax expense
(261,112)
(8,379)
(10,419)
–
(279,910)
Earnings available to common shareholders
$
489,001
$
16,168
$
19,354
$
(35,522)
$
489,001
(a) Balances for the year ended December 31, 2015
(b) Eliminate intercompany lease / interest income
(c) Eliminate intercompany premiums
(d) Eliminate equity in earnings of subsidiaries