U-Haul 2016 Annual Report Download - page 40
Download and view the complete annual report
Please find page 40 of the 2016 U-Haul annual report below. You can navigate through the pages in the report by either clicking on the pages listed below, or by using the keyword search tool below to find specific information within the annual report.-
 1
1 -
2
-
3
-
4
-
5
-
6
-
7
-
8
-
9
-
10
-
11
-
12
-
13
-
14
-
15
-
16
-
17
-
18
-
19
-
20
-
21
-
22
-
23
-
24
-
25
-
26
-
27
-
28
-
29
-
 30
30 -
 31
31 -
 32
32 -
 33
33 -
 34
34 -
 35
35 -
 36
36 -
 37
37 -
 38
38 -
 39
39 -
 40
40 -
 41
41 -
 42
42 -
 43
43 -
 44
44 -
 45
45 -
 46
46 -
 47
47 -
 48
48 -
 49
49 -
 50
50 -
51
-
52
-
53
-
54
-
55
-
56
-
57
-
58
-
59
-
60
-
61
-
62
-
63
-
64
-
65
-
66
-
67
-
68
-
69
-
70
-
71
-
72
-
73
-
74
-
75
-
76
-
77
-
78
-
79
-
80
-
81
-
82
-
83
-
84
-
85
-
86
-
87
-
88
-
89
-
90
-
91
-
92
-
93
-
94
-
95
-
96
-
97
-
98
-
99
-
100
-
101
-
102
-
103
-
104
-
105
-
106
-
107
-
108
-
109
-
110
-
111
-
112
-
113
-
114
-
115
-
116
-
117
-
118
-
119
-
120
-
121
-
122
-
123
-
124
-
125
-
126
-
127
-
128
-
129
-
130
 |
 |
34
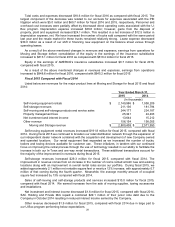
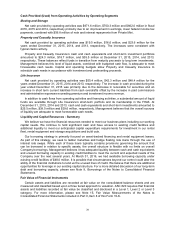
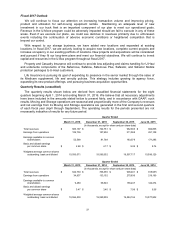
Cash Provided (Used) from Operating Activities by Operating Segments
Moving and Storage
Net cash provided by operating activities was $971.6 million, $700.3 million and $662.0 million in fiscal
2016, 2015 and 2014, respectively primarily due to an improvement in earnings, lower federal income tax
payments, combined with $56.8 million of note and interest repayments from Private Mini.
Property and Casualty Insurance
Net cash provided by operating activities was $19.0 million, $16.6 million, and $23.6 million for the
years ended December 31, 2015, 2014, and 2013, respectively. The increases were consistent with
typical claims activity.
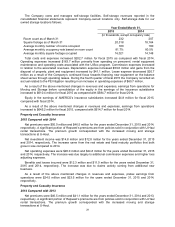
Property and Casualty Insurance’s cash and cash equivalents and short-term investment portfolios
amounted to $24.3 million, $18.7 million, and $35.5 million at December 31, 2015, 2014, and 2013,
respectively. These balances reflect funds in transition from maturity proceeds to long term investments.
Management believes this level of liquid assets, combined with budgeted cash flow, is adequate to meet
foreseeable cash needs. Capital and operating budgets allow Property and Casualty Insurance to
schedule cash needs in accordance with investment and underwriting proceeds.
Life Insurance
Net cash provided by operating activities was $50.4 million, $42.3 million and $48.4 million for the
years ended December 31, 2015, 2014 and 2013, respectively. The increase in cash provided during the
year ended December 31, 2015 was primarily due to the decrease in receivable for securities and an
increase in short term current liabilities from cash overdrafts offset by the increase in paid commissions
and administrative expenses exceeding premium and investment income revenue.
In addition to cash flows from operating activities and financing activities, a substantial amount of liquid
funds are available through Life Insurance's short-term portfolio and its membership in the FHLB. At
December 31, 2015, 2014 and 2013, cash and cash equivalents and short-term investments amounted to
$25.5 million, $39.0 million and $39.6 million, respectively. Management believes that the overall sources
of liquidity are adequate to meet foreseeable cash needs.
Liquidity and Capital Resources - Summary
We believe we have the financial resources needed to meet our business plans including our working
capital needs. We continue to hold significant cash and have access to existing credit facilities and
additional liquidity to meet our anticipated capital expenditure requirements for investment in our rental
fleet, rental equipment and storage acquisitions and build outs.
Our borrowing strategy is primarily focused on asset-backed financing and rental equipment leases.
As part of this strategy, we seek to ladder maturities and hedge floating rate loans through the use of
interest rate swaps. While each of these loans typically contains provisions governing the amount that
can be borrowed in relation to specific assets, the overall structure is flexible with no limits on overall
Company borrowings. Management believes it has adequate liquidity between cash and cash equivalents
and unused borrowing capacity in existing credit facilities to meet the current and expected needs of the
Company over the next several years. At March 31, 2016, we had available borrowing capacity under
existing credit facilities of $48.0 million. It is possible that circumstances beyond our control could alter the
ability of the financial institutions to lend us the unused lines of credit. We believe that there are additional
opportunities for leverage in our existing capital structure. For a more detailed discussion of our long-term
debt and borrowing capacity, please see Note 9, Borrowings of the Notes to Consolidated Financial
Statements.
Fair Value of Financial Instruments
Certain assets and liabilities are recorded at fair value on the consolidated balance sheets and are
measured and classified based upon a three tiered approach to valuation. ASC 820 requires that financial
assets and liabilities recorded at fair value be classified and disclosed in a Level 1, Level 2 or Level 3
category. For more information, please see Note 15, Fair Value Measurements of the Notes to
Consolidated Financial Statements included in Part II, Item 8 of this Form 10-K.