U-Haul 2016 Annual Report Download - page 41
Download and view the complete annual report
Please find page 41 of the 2016 U-Haul annual report below. You can navigate through the pages in the report by either clicking on the pages listed below, or by using the keyword search tool below to find specific information within the annual report.-
 1
1 -
2
-
3
-
4
-
5
-
6
-
7
-
8
-
9
-
10
-
11
-
12
-
13
-
14
-
15
-
16
-
17
-
18
-
19
-
20
-
21
-
22
-
23
-
24
-
25
-
26
-
27
-
28
-
29
-
30
-
 31
31 -
 32
32 -
 33
33 -
 34
34 -
 35
35 -
 36
36 -
 37
37 -
 38
38 -
 39
39 -
 40
40 -
 41
41 -
 42
42 -
 43
43 -
 44
44 -
 45
45 -
 46
46 -
 47
47 -
 48
48 -
 49
49 -
 50
50 -
 51
51 -
52
-
53
-
54
-
55
-
56
-
57
-
58
-
59
-
60
-
61
-
62
-
63
-
64
-
65
-
66
-
67
-
68
-
69
-
70
-
71
-
72
-
73
-
74
-
75
-
76
-
77
-
78
-
79
-
80
-
81
-
82
-
83
-
84
-
85
-
86
-
87
-
88
-
89
-
90
-
91
-
92
-
93
-
94
-
95
-
96
-
97
-
98
-
99
-
100
-
101
-
102
-
103
-
104
-
105
-
106
-
107
-
108
-
109
-
110
-
111
-
112
-
113
-
114
-
115
-
116
-
117
-
118
-
119
-
120
-
121
-
122
-
123
-
124
-
125
-
126
-
127
-
128
-
129
-
130
 |
 |

35
The available-for-sale securities held by the Company are recorded at fair value. These values are
determined primarily from actively traded markets where prices are based either on direct market quotes
or observed transactions. Liquidity is a factor considered during the determination of the fair value of
these securities. Market price quotes may not be readily available for certain securities or the market for
them has slowed or ceased. In situations where the market is determined to be illiquid, fair value is
determined based upon limited available information and other factors including expected cash flows. At
March 31, 2016, we had $0.3 million of available-for-sale assets classified in Level 3.
The interest rate swaps held by us as hedges against interest rate risk for our variable rate debt are
recorded at fair value. These values are determined using pricing valuation models which include broker
quotes for which significant inputs are observable. They include adjustments for counterparty credit
quality and other deal-specific factors, where appropriate and are classified as Level 2.
Disclosures about Contractual Obligations and Commercial Commitments
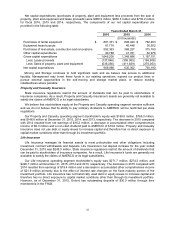
The following table provides contractual commitments and contingencies as of March 31, 2016:
Payment due by Period (as of March 31, 2016)
Contractual Obligations
Total
04/01/16 -
03/31/17
04/01/17 -
03/31/19
04/01/19 -
03/31/21
Thereafter
(In thousands)
Notes and loans payable - Principal
$
1,668,933
$
215,344
336,609
$
156,920
$
960,060
Notes and loans payable - Interest
566,309
72,402
113,627
92,069
288,211
Revolving credit agreements - Principal
347,000
–
57,000
178,887
111,113
Revolving credit agreements - Interest
24,268
6,300
11,560
5,755
653
Capital leases - Principal
672,825
138,463
252,909
236,212
45,241
Capital leases - Interest
50,275
17,712
23,805
7,904
854
Operating leases
179,844
36,622
61,064
34,685
47,473
Property and casualty obligations (a)
144,652
12,275
16,638
12,779
102,960
Life, health and annuity obligations (b)
2,925,140
219,492
397,441
364,409
1,943,798
Self insurance accruals (c)
384,921
108,008
160,212
63,384
53,317
Post retirement benefit liability
13,850
658
1,687
2,336
9,169
Total contractual obligations
$
6,978,017
$
827,276
$
1,432,552
$
1,155,340
$
3,562,849
(a) These estimated obligations for unpaid losses and loss adjustment expenses include case reserves for reported claims and
IBNR claims estimates and are net of expected reinsurance recoveries. The ultimate amount to settle both the case reserves and
IBNR is an estimate based upon historical experience and current trends and such estimates could materially differ from actual
results. The assumptions do not include future premiums. Due to the significant assumptions employed in this model, the amounts
shown could materially differ from actual results.
(b) These estimated obligations are based on mortality, morbidity, withdrawal and lapse assumptions drawn from our historical
experience and adjusted for any known trends. These obligations include expected interest crediting but no amounts for future
annuity deposits or premiums for life and Medicare supplement policies. The cash flows shown are undiscounted for interest and as
a result total outflows for all years shown significantly exceed the corresponding liabilities of $1,383.7 million included in our
consolidated balance sheet as of March 31, 2016. Life Insurance expects to fully fund these obligations from their invested asset
portfolio. Due to the significant assumptions employed in this model, the amounts shown could materially differ from actual results.
(c) These estimated obligations are primarily the Company’s self insurance accruals for portions of the liability coverage for our
rental equipment. The estimates for future settlement are based upon historical experience and current trends. Due to the significant
assumptions employed in this model, the amounts shown could materially differ from actual results.
As presented above, contractual obligations on debt and guarantees represent principal payments
while contractual obligations for operating leases represent the notional payments under the lease
arrangements.
ASC 740 - Income Taxes liabilities and interest of $29.8 million is not included above due to
uncertainty surrounding ultimate settlements, if any.
Off Balance Sheet Arrangements
The Company uses off-balance sheet arrangements in situations where management believes that the
economics and sound business principles warrant their use.