U-Haul 2016 Annual Report Download - page 95
Download and view the complete annual report
Please find page 95 of the 2016 U-Haul annual report below. You can navigate through the pages in the report by either clicking on the pages listed below, or by using the keyword search tool below to find specific information within the annual report.-
 1
1 -
2
-
3
-
4
-
5
-
6
-
7
-
8
-
9
-
10
-
11
-
12
-
13
-
14
-
15
-
16
-
17
-
18
-
19
-
20
-
21
-
22
-
23
-
24
-
25
-
26
-
27
-
28
-
29
-
30
-
31
-
32
-
33
-
34
-
35
-
36
-
37
-
38
-
39
-
40
-
41
-
42
-
43
-
44
-
45
-
46
-
47
-
48
-
49
-
50
-
51
-
52
-
53
-
54
-
55
-
56
-
57
-
58
-
59
-
60
-
61
-
62
-
63
-
64
-
65
-
66
-
67
-
68
-
69
-
70
-
71
-
72
-
73
-
74
-
75
-
76
-
77
-
78
-
79
-
80
-
81
-
82
-
83
-
84
-
 85
85 -
 86
86 -
 87
87 -
 88
88 -
 89
89 -
 90
90 -
 91
91 -
 92
92 -
 93
93 -
 94
94 -
 95
95 -
 96
96 -
 97
97 -
 98
98 -
 99
99 -
 100
100 -
 101
101 -
 102
102 -
 103
103 -
 104
104 -
 105
105 -
106
-
107
-
108
-
109
-
110
-
111
-
112
-
113
-
114
-
115
-
116
-
117
-
118
-
119
-
120
-
121
-
122
-
123
-
124
-
125
-
126
-
127
-
128
-
129
-
130
 |
 |

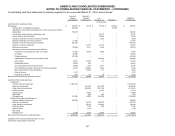
AMERCO AND CONSOLIDATED SUBSIDIARIES
NOTES TO CONSOLIDATED FINANCIAL STATEMENTS – (CONTINUED)
F-39
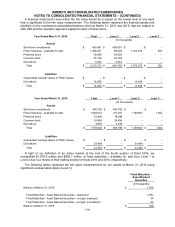
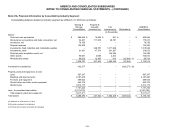
Note 21. Financial Information by Geographic Area
United
States
Canada
Consolidated
(All amounts are in thousands U.S. $'s)
Fiscal Year Ended March 31, 2016
Total revenues
$
3,130,097
$
145,559
$
3,275,656
Depreciation and amortization, net of (gains) losses on disposal
313,099
863
313,962
Interest expense
97,739
164
97,903
Pretax earnings
745,194
23,717
768,911
Income tax expense
273,473
6,437
279,910
Identifiable assets
7,901,365
249,360
8,150,725
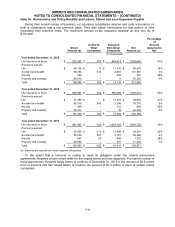
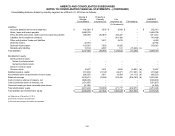
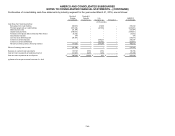
United
States
Canada
Consolidated
(All amounts are in thousands U.S. $'s)
Fiscal Year Ended March 31, 2015
Total revenues
$
2,916,027
$
158,504
$
3,074,531
Depreciation and amortization, net of (gains) losses on disposal
292,345
5,481
297,826
Interest expense
96,979
546
97,525
Pretax earnings
541,371
20,047
561,418
Income tax expense
199,444
5,233
204,677
Identifiable assets
6,685,572
186,603
6,872,175
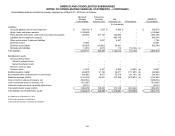
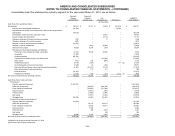
United
States
Canada
Consolidated
(All amounts are in thousands U.S. $'s)
Fiscal Year Ended March 31, 2014
Total revenues
$
2,681,800
$
153,452
$
2,835,252
Depreciation and amortization, net of (gains) losses on disposal
272,236
7,358
279,594
Interest expense
92,128
564
92,692
Pretax earnings
516,207
21,315
537,522
Income tax expense
189,419
5,712
195,131
Identifiable assets
5,854,503
144,475
5,998,978
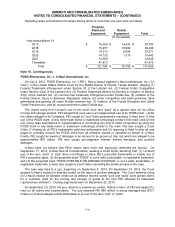
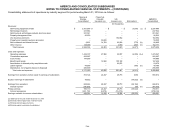
Note 21A. Consolidating Financial Information by Industry Segment
AMERCO’s three reportable segments are:
Moving and Storage, comprised of AMERCO, U-Haul, and Real Estate and the subsidiaries of U-
Haul and Real Estate,
Property and Casualty Insurance, comprised of Repwest and its subsidiaries and ARCOA, and
Life Insurance, comprised of Oxford and its subsidiaries.
Management tracks revenues separately, but does not report any separate measure of the profitability
for rental vehicles, rentals of self-storage spaces and sales of products that are required to be classified
as a separate operating segment and accordingly does not present these as separate reportable
segments. Deferred income taxes are shown as liabilities on the consolidating statements.
The information includes elimination entries necessary to consolidate AMERCO, the parent, with its
subsidiaries.
Investments in subsidiaries are accounted for by the parent using the equity method of accounting.